Metrics Dashboard: Manage Your Company Using Data
Peter Drucker famously has proclaimed, “What gets measured, gets managed.” Thus, the leaders in the best organizations use metrics to manage and grow their businesses. Thus, you should manage your business or department with no more than 15 metrics, which are typically organized on a metrics dashboard.
What is a Metrics Dashboard?
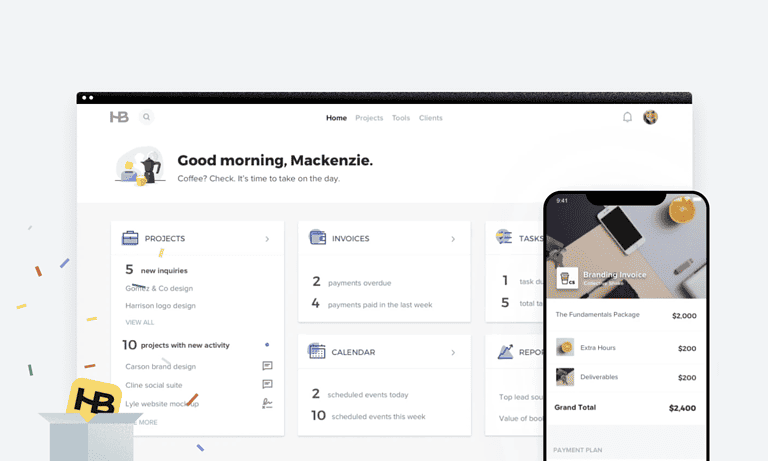
The metrics dashboard is a weekly or quarterly report that tracks a handful of high-level metrics for your organization as a whole or departments within. The data will help guide team discussions and decisions instead of using assumptions, opinions, and emotions.
Most companies do not use metrics regularly. The leaders will subjectively try to seek out project statuses and ongoing issues from people, intuition, and discussions. Or they will wait to review their financial statements at the end of a quarter. Either you may not be aware of a problem or be too late to make decisions to correct your course. Instead, the metrics dashboard will proactively provide you and your team metrics to:
- Have a quick understanding of your business or department
- Provide objective metrics instead of stories or opinions
- Forecast the future progress of metrics and projects
- Identify problems and goals that are tracking toward the expectations
- Resolve problems and change direction mid-project or mid-quarter
- Help you take the entrepreneurial leap

How to Create Your Metrics Dashboard
Your metrics dashboard will be unique to your organization, so here is a process to select the right metrics and create one that fits your business:
- Brainstorm Possible Metrics: Spend time with your team to produce possible numbers that will allow you to have a handle on your business or department. Use your long-term vision or goals to guide the metrics your choose. Below is a list of commonly used metrics.
- Decide on the High-level Metrics: These SMART metrics will be shown on your business dashboard. Remember, decide on a handful of metrics, as less is actually more valuable for running your business or department.
- Create your Metrics Dashboard: List each metric and determine the expected SMART goal for the quarter (quarterly rock) that corresponds to your long-term goals or vision. Determine the individual responsible for reporting that business metric and how often.
- Implement the Dashboard Regularly. Have responsible members of your team collect data. Then, use it during regular meetings to track the progress toward your SMART goals for your company, departments, or people.
- Observe Patterns: Ask yourself, what are the metrics telling you? Use the business dashboard to indicate progress, behavior, or potential problems and keep all data for future reference. If there seems to be poor or low numbers, make adjustments to the metrics as needed to improve the business, department, or individual.
Possible Metrics for Your Metrics Dashboard
For your metrics dashboard, you need to use metrics that are proactive and indicate activity. These metrics will indicate actions taken by your employees. When a metric is missing a benchmark set, it may indicate a problem and will help you find a solution. Also, you allow the appropriate employee to solve the issue on their own.
Below are potential metrics that you can use for your metrics dashboard:
- Revenue (Sales) – the income generated from normal business operations and other business activities
- Formula: Sales Revenue = (Sales Price) × (Number of Units Sold)
- Example: You sold 15 products for $10 each to earn $150 in revenue.
- Cash Balance – the amount of money held within company accounts
- Formula: Cash Balance = (Previous Cash Balance) + (Cash Flow)
- Example: You started the week will $10,000 in cash. During the week, you had an inflow of $5,000 to end with $15,000 in cash balance.
- Cash Flow – the net amount of cash transferred into and out of a business for a given time period
- Formula: Cash Flow = (Money Received) – (Money Spent)
- Example: Your company received $15,000 in sales and paid a supplier $5,000 for services, so your cash flow was +$10,000.
- Sales Activity – the number of actions taken, which may include leads generated, calls made, contacts sent, proposals created, presentations made, and so on
- Formula: Average Sales Activity = (Number of Actions) / Time
- Example: During the workweek, your sales team made 100 phone calls that week to prospects from your company database. Your sales activity averaged 20 calls/day.
- Sales Conversion Rate (SCR) – the percentage of leads that your company has converted into paying customers
- Formula: SCR = (Number of Units Sold) / (Number of Actions) x 100%
- Example: Your sales team converted 13 from their 100 phone calls to get an SCR of 13% for the week.
- Customer Acquisition Cost (CAC) – the measure of the total cost of marketing required to gain a customer
- Formula: CAC = (Money Spent) / (Number of Units Sold)
- Example: You conducted an advertising campaign for $100 and sold 4 customers for a CAC of $25 per customer.
- Customer Satisfaction – the measure of how happy your customers are with your company’s products or services
- Method: Provide a survey to have your customers provide ratings (scale from 1-10) for your goods, services, or customer service.
- Example: After launching your new product, customers rated their satisfaction, on average, at an 8 out of 10.
- Severity/Number of Issues – the number of major and minor issues faces by customers or employees regarding your product, services, or customer service
- Method: Record the number and severity (scale of 1-10) of issues faced by the customer or employees.
- Example: After launching your new product, five (rated > 7) significant issues were faced during the first month.
- Accounts Receivable (AR) – the money your customers owe you for goods or services they purchased from you in the past
- Example: Your company is owed $4,600 AR for goods sold to customers on credit.
- Accounts Payable (AP) – the total money your company owes to vendors or suppliers for goods or services received that you have not yet paid for
- Example: Your company owes $5,300 AP for services provided that you haven’t paid for.
- Client Project Status – the percentage of progress has made on a given project
- Formula: Project Status = (Amount of Work Done) / (Total Project Work) x 100%
- Example: There are about 100 hours of work required to finish a client project. Since you have completed 30 hours, you are at 30% in terms of progress.
Conclusion
Over time, your metrics dashboard will evolve to be a fantastic tool to use metrics to manage your business. It will take about a quarter to a year for the tool to be improved to fit your organization. Eventually, you will be able to use a handful of metrics to get a quick understanding of what is happening in your company as a whole or departments within.
The metrics dashboard will transform the perspectives of individuals at all levels of an organization. Your people and decision-making from being less reactive to becoming more proactive and action-oriented. Your people will be empowered to take action, solve issues, and anticipate future ones.
For more on implementing metrics dashboards using the EOS process, check out Traction (book summary) or What the Heck is EOS? (book summary) by Gino Wickman. For help on how to get organized at work check out this blog post.
Next Steps
If you have any further questions or need additional help, feel free to comment below or send me an email. Also, if you want more Process Hacker content, you should subscribe to our short weekly newsletter on Productivity, Habits, and Resources.


