
Leading vs Lagging Indicators
Metrics are critical in business to track your progress and know if you are successful. However, what are the right indicators to use?
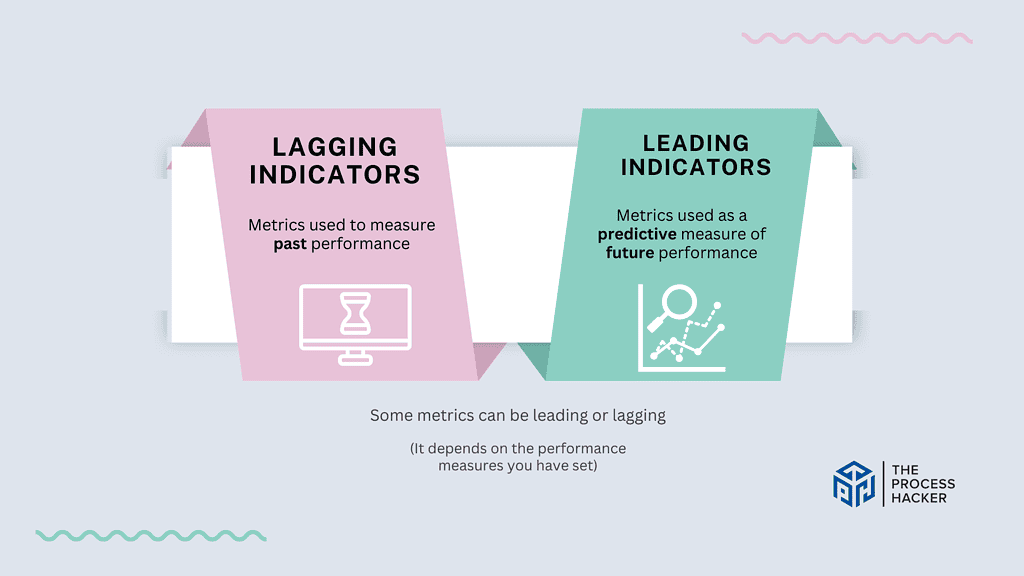
There are two types of metrics: leading indicators assess future performance and help inform decision-making, while lagging indicators measure past performance and indicate results. While both have their own benefits, we will examine whether one is better than the other in our leading vs lagging indicators breakdown.
Some argue that focusing solely on leading indicators can lead to making short-term decisions. In contrast, others believe that relying too heavily on lagging indicators may cause missed opportunities.
In this blog post, we will examine the differences between these indicators and discuss which is more effective in driving progress toward your goals.
What Is A Lagging Indicator?

A lagging indicator is a metric that reflects the results of actions already taken in the past.
Think of it as looking in the rearview mirror; it provides a clear view of what has already happened. In the context of leadership, these indicators often pertain to financial outcomes, employee turnover rates, or overall company performance metrics that are measured after a specific period has elapsed.
Lagging indicators encourage you to measure the effectiveness of past decisions and strategies. They are objective, straightforward to measure, and the foundation for evaluating the organization’s health and success. However, since they report on outcomes that have already occurred, their use in forecasting future performance or preemptively addressing issues is limited.
Focusing on past achievements and areas for improvement, you can use lagging indicators to reinforce successful strategies and reconsider those that did not yield the desired results. Unlike leading indicators, this approach ensures that your leadership is informed by what has transpired and grounded in a commitment to continuous improvement and adaptation.
What Is A Leading Indicator?

A leading indicator measures your actions, which can predict future events or outcomes before they happen.
The beauty of the ability to identify leading indicators lies in their ability to allow you to anticipate and prepare for what’s ahead rather than simply reacting to events after they’ve occurred. They empower you to implement strategies and make real-time adjustments, ensuring your organization remains agile and responsive to opportunities and challenges.
For example, a push to send out new email campaigns or conduct more outbound phone calls in a business context could increase the sales cycle length or market interest. Similarly, an uptick in employee productivity and satisfaction might predict higher productivity and lower turnover rates.
Identifying metrics that predict the key outcomes in your context is important to leverage leading metrics effectively. Regularly tracking and analyzing these indicators will enable you to stay one step ahead and make real-time decisions that drive success and sustainable growth.
Quick Comparison: Leading vs Lagging Indicators
| Metric | Leading Indicators | Lagging Indicators |
|---|---|---|
| Definition | Action-oriented metrics that predict future events or outcomes. | Results-oriented metrics that reflect the outcomes of actions already taken. |
| Purpose | To forecast and guide proactive decision-making. | To evaluate past performance and outcomes. |
| Examples | – Increase in outbound sales calls – Number of quality blogs produced – Reduce company operating costs | – Quarterly revenue and profit figures – Employee turnover rate – Customer satisfaction surveys |
| Advantages | – Allows for real-time adjustments – Determines actions that drive results – Encourages proactive strategy | – Provides concrete evidence of past performance – Validates the effectiveness of strategies – Easy to measure and understand |
| Limitations | – Can be speculative and not consistently accurate – Requires constant monitoring and analysis | – Reflects past events, offering no insight into the future – Can lead to reactive rather than proactive decision-making |
Why It Is Important to Understand the Difference In Business
Grasping the distinction between leading and lagging indicators helps you determine what’s working and what’s not, identify issues, and measure success.
These indicators are the lighthouses guiding you through the fog of economic health uncertainty, illuminating the path forward, and reflecting on the journey behind. This understanding empowers you to anticipate shifts, validate strategies, and confidently navigate the economic environment’s complexities.
- Anticipation of Changing Market Trends: Leading indicators offer a glimpse into your company’s and the market’s future, preparing you for what lies ahead.
- Strategic Planning: With insights into potential company trends, you can strategize effectively, positioning your business to take more actions that drive growth.
- Performance Evaluation: Lagging indicators help you assess the outcomes of past decisions, providing a concrete basis for measuring success.
- Risk Management: By understanding which indicators signal upcoming changes, you can mitigate internal risks more effectively.
- Competitive Advantage: Staying informed about both sets of indicators can give you an edge over competitors who may not be as adept at interpreting these signals.
Recognizing the importance of this skill is just the beginning. I propose not merely identifying these indicators but integrating them into a holistic business strategy and decision-making approach.
This approach enables you to make informed decisions that are both proactive and reflective. It’s about equipping you with the tools to survive and thrive in this fast-paced digital landscape, making your business resilient and agile.
How to Set Strategic Goals Using Lagging Indicators

While focusing on the past, Lagging indicators offer a powerful starting point for setting achievable, data-driven goals. Here’s a simple process to transform those historical insights into a roadmap for the future:
- Identify Key Goals: Focus on the big-picture objectives you want to achieve.
- Define Your Laggers: Determine the lagging indicators directly for your key goals.
- Benchmark Performance: Analyze past data to understand the context of your starting point.
- Set Ambitious Targets: Push beyond the status quo by aiming to create a stretch goal. Bill Gates said, “Most people overestimate what they can do in one year and underestimate what they can do in ten years.”
- Track and Iterate: Regularly monitor your lagging indicators to assess progress and make necessary adjustments.
Ready to explore this process further? Let’s explore how to analyze lagging indicators, set realistic targets, and use the insights for strategic growth.
Step 1: Identify Key Goals
Before going through the historical data, clearly define the core strategic objectives you want to achieve. These objectives represent the overarching results that will propel your organization toward success. You should consider the following:
- Utilize the SMART framework: Ensure goals are Specific, Measurable, Achievable, Relevant, and Time-bound.
- Prioritize focus: Limit the number of key goals to maintain clarity and avoid diluting strategic efforts.
- Maintain strategic alignment: Verify that goals directly contribute to your organization’s long-term mission.
Example: To improve customer satisfaction, a key goal might be: “Increase the customer retention rate by 15% in the next year.”
Step 2: Define Your Laggers

Now that you’ve outlined your key goals, we’ll pinpoint the lagging indicators directly quantifying progress. These indicators show you how historical trends influence your strategic objectives. Select the right lagging indicators by doing the following:
- Prioritize relevance: Choose lagging indicators with a demonstrable cause-and-effect correlation to your key goals.
- Focus on quantifiable metrics: Select indicators that can be measured (e.g., revenue, customer churn, market share) for objective tracking.
- Verify data accessibility: Ensure that you or a member of your team can obtain reliable historical data for the chosen metrics.
Example: If your key goal is increasing customer retention, relevant lagging indicators include:
- Customer Churn Rate (%)
- Net Promoter Score (NPS)
- Average Customer Lifetime Value (CLV)
Step 3: Benchmark Performance
With key goals and relevant lagging indicators identified, you must understand where you are now. Thus, it’s crucial to establish performance benchmarks using the historical data by considering the following:
- Timeframe: Analyze data across relevant periods (e.g., monthly, quarterly, annually) to align with your key goals.
- Data analysis: Utilize data analysis tools and visualization techniques to identify trends, patterns, and areas for improvement within your lagging indicators.
- Contextualize insights: Consider external factors or industry-specific conditions that may have influenced past performance.
Example: If your key goal is increasing customer retention, examine historical churn rates, NPS trends, and average customer lifetime value. This analysis could show periods of increased churn or fluctuations in customer satisfaction to help you set better targets.
Step 4: Set Ambitious Targets
Now that you understand your historical performance, it’s time to push beyond the status quo and set goals that drive significant improvement. You can set Big Hairy Audacious Goals (BHAG) by doing the following:
- Challenging but realistic: Aim for targets that require effort and a stretch, but avoid setting yourself up for failure with overly unrealistic expectations.
- Data-driven: Use the benchmarks to inform setting targets, ensuring your goals align with historical trends and desired growth opportunities.
- Communicate and align: Share these targets with relevant team members and clients to promote transparency and ensure buy-in for strategic initiatives.
Example: If your benchmark analysis revealed an average customer churn rate of 10%, an ambitious target might aim for a 15%-20% reduction over the upcoming year.
Remember, this is an iterative process. Monitor your progress regularly and adjust targets based on ongoing analysis of your lagging indicators.
Step 5: Track and Iterate

Goal setting isn’t simply a “set-it-and-forget-it” activity. The real impact comes from regularly monitoring progress and being flexible enough to make strategic adjustments. You can effectively iterate on your leading indicators by:
- Review metrics regularly: Determine how often you’ll review your lagging indicators (e.g., weekly, monthly, quarterly).
- Use dashboards and reporting: Create visualizations with a clear, at-a-glance view of your performance against targets.
- Analyze and adjust: If progress is slower than desired, investigate the cause and determine what action or leading indicators to influence.
Example: To increase customer retention, regularly track churn rates and NPS. If progress stalls, reassess your customer service strategies, loyalty programs, or communication efforts.
Remember, agility is key in a dynamic business environment. You ensure your strategic goals remain relevant and achievable by actively tracking and iterating.
How to Take Action on the Leading Indicators

Lagging indicators provide retrospective insight, but leading indicators give you the edge for proactive decision-making. Let’s help you pick the right leading indicators and take action:
- Choose Leading Indicators: Determine the key actions with leading metrics impacting your higher-level and lagging objectives.
- Insight to Action: Analyze leading indicators closely to identify potential trends, opportunities, or emerging risks.
- Strategize & Prioritize: Develop specific action plans addressing areas identified through your leading indicator analysis.
- Resource Allocation Shuffle: Shift resources and investments towards initiatives aligning with anticipated trends or addressing risks you’ve uncovered.
- Track & Respond: Regularly monitor results and adapt based on ongoing evaluation of leading indicators.
Ready to turn your predictive insights into a competitive advantage? Let’s dive into specific examples of leading indicators and how to leverage them effectively in your decision-making processes.
Step 1: Choose Leading Indicators
Most company leadership focuses too heavily on lagging metrics and high-level goals. However, to influence these metrics and objects, you need to create relevant leading metrics that are:
- Measurable: Provide quantifiable tracking of your planned actions
- Predictive: Measures something that results in the success of the goal
- Influenceable: Impacts the actions that you have control over that produce outcomes
The leading metrics give you leverage by executing the highest-leverage actions to achieve the high-level goals, measured by lagging metrics. You are taking a strategic bet by hypothesizing that certain high-leverage activities will drive progress toward your goal.
Examples: If your key objective is to increase sales from your email list by 20%, you can create the following leading indicators:
- Number of blogs produced per week
- Number of sales emails sent per month
- Number of outreach emails sent for collaborations
Further, you can use the 80/20 Rule to determine how effective specific actions are in achieving the high-level objectives. This principle encourages you to choose the 20 percent of the highest-leverage actions that will have an 80 percent impact your goals.
Step 2: Insight to Action

Leading indicators reveal trends or issues, so you must translate those insights into actionable steps. Here’s how to unlock the potential of your leading indicators:
- Go beyond the numbers: Look for patterns, anomalies, and potential correlations between your leading indicators and business goals.
- Think critically: Ask yourself, “What is the data saying about my effectiveness or potential issues? What opportunities or challenges could be created?”
- Collaborate: Share insights with your team for broader perspectives or empower the appropriate team member to find potential solutions.
Example: If you notice that your new sales emails create a surge in sales for a specific product category, it suggests that you took the right action, so lean into it. Consider increasing inventory to meet potential demand surges or launching targeted marketing campaigns.
This initial analysis lays the foundation for taking targeted action.
Step 3: Strategize and Prioritize
Now that you’ve extracted valuable insights from your leading indicators, it’s time to prioritize actions that will most impact your desired outcomes. Here are the keys to prioritizing the right actions:
- Align with business goals: Ensure your leading actions directly support your key strategic objectives.
- Consider potential impact: Evaluate which actions from your leading indicators yield the most significant results.
- Rank initiatives: Prioritize actions based on urgency, importance, and the potential return on investment.
Example: If rising interest in a product category aligns with your growth objectives, potential actions might include:
- Investing in additional marketing or promotions
- Enhancing product development initiatives in this area
- Reassessing your pricing strategy for related products
Remember, a focused approach is essential! Avoid getting overwhelmed by trying to address everything at once.
Step 4: Put Your Resources to Work
Strategic plans are only effective when backed by the right resources. Thus, you need to focus your and your team’s effort, time, and money toward capitalizing on the opportunities by:
- Evaluate growth opportunities: Examine where your cash reserves can be directed to support your strategic initiatives.
- Optimize processes: Determine if you need to identify, document, and optimize processes to improve consistency and operational efficiency.
- Invest in people: Add the right skills by training your existing team, outsourcing to a freelancer, or hiring specialists to improve leading metrics.
- Invest in technology: Identify tools or platforms to automate processes, incorporate AI, streamline data analysis, or support new initiatives.
Example: If leading indicators suggest growing demand for a new service, consider reallocating your extra cash from less promising initiatives, hiring or upskilling team members with relevant expertise, and investing in a platform to manage the new service offering.
Remember, flexibility is key! Be prepared to make decisions and put resources to work as your leading indicators evolve and new opportunities emerge.
Step 5: Track and Improve

Taking action on leading indicators is an ongoing process, not a one-and-done task. Regularly track and continuously improve to ensure your actions deliver the desired results and remain relevant in an ever-changing landscape by:
- Change your leading metrics: Don’t be afraid to change the leading metrics to better align with your actions and track them regularly.
- Visualize for easier evaluation: Utilize dashboards or reports to visualize your leading indicators and monitor progress against your targets.
- Iterate and adjust: If results and lagging indicators fall short, investigate the cause in your leading indicators. Adjust your approach, experiment with new strategies, or re-evaluate your leading indicators as needed.
Example: If your marketing campaign targeting a new product category doesn’t yield the expected boost in website traffic or sales pipeline, it’s time to reassess your strategy. Tweak your messaging, analyze targeting, or consider a different approach entirely.
Remember, agility is your superpower! Tracking your progress and taking action will transform your metrics into a powerful tool for continuous improvement and strategic advantage.
Examples of Leading vs Lagging Indicators
Leading indicators act as the forecast, alerting you to prepare for what’s on the horizon. Here are some examples:
- Number of Content Created: By producing more high-quality blog posts or YouTube videos, you can see what actions result in higher traffic and engagement and potentially more sales. It’s like noticing more foot traffic in a brick-and-mortar store; it signals interest and intent.
- Outbound Sales Calls or Emails: When you increase the volume of your outreach efforts, you will see if it is working or not. When you figure out a winning target market and see engagement going up, you can increase your efforts, which can result in an uptick in customer inquiries and sales.
- Employee Satisfaction Scores: High scores on employee satisfaction surveys can predict positive future outcomes, such as enhanced productivity, better customer service, and lower turnover rates. Happy employees often lead to happy customers.
While lagging indicators serve as the history lesson, providing valuable insights from past actions. Here are some examples:
- Quarterly Sales Figures: This classic lagging indicator measures the effectiveness of past sales strategies and market demand. It’s a solid measure of financial health, but it looks at the past and offers no foresight into future sales trends.
- Customer Satisfaction Surveys: Completed after a transaction or interaction, these offer insights into what customers thought about your product or service. While invaluable for improving future offerings, they reflect past successes or failures.
- Employee Turnover Rate: This metric shows how many employees have left the company over a specific period. It’s a clear indicator of the organizational health and culture in retrospect but doesn’t predict future retention challenges.
By examining these examples, you can better appreciate the roles that leading and lagging indicators play in steering your organization’s ship. Balancing both indicators in your strategic approach ensures that you’re learning from where you’ve been and have a clear vision of where you’re going.
Taking it to the Next Level: Read The 4 Disciplines of Execution
Expand your knowledge with leading and lagging indicators in “The 4 Disciplines of Execution” by Chris McChesney, Sean Covey, and Jim Huling. This book goes beyond the basics of performance metrics, offering a blueprint for achieving your wildly important goals amidst the whirlwind of daily activities.
The framework introduced emphasizes focusing on the few critical objectives that can make all the difference rather than getting lost in the sea of the ‘urgent but not important.’ It teaches you how to act on lead measures, keep a compelling scoreboard, and create a cadence of accountability. Integrating these disciplines with the strategic use of leading and lagging indicators can revolutionize your approach to achieving future success.
By applying “The 4 Disciplines of Execution,” you’re not just tracking performance but actively driving it. This approach ensures that your team is aware of what success looks like and consistently makes moves that directly contribute to achieving those outcomes. Elevate your strategic execution and transform how your goals are pursued and achieved.
Final Thoughts on Leading and Lagging Indicators

Throughout this deep dive into leading and lagging indicators, we’ve unpacked these metrics’ pivotal roles in shaping strategic decisions and fostering business growth.
With their predictive qualities, leading indicators empower you to proactively anticipate changes and adapt strategies. On the other hand, lagging indicators offer a retrospective analysis, providing concrete evidence of past actions’ effectiveness.
Balancing these two indicators is not just about measuring performance; it’s about collecting data to show where your organization has been and where it’s heading. It’s about turning insights into action and predictions into plans.
Staying informed and adaptable is key to success in the constantly evolving business and leadership landscape. By tracking leading and lagging indicators, you equip yourself with the tools for insightful decision-making and strategic foresight.
Whether you aim to enhance your leadership skills, drive your team toward success, or steer your organization through uncharted waters, these key performance indicators will help you grow!