
Kanban Charts: The Ultimate Guide To Measuring Your Kanban Efforts
Looking to measure and monitor your Kanban efforts but need help figuring out where to start?
The ultimate guide to measuring your Kanban efforts is here! Kanban Charts provides an easy-to-follow roadmap for you to understand – and, more importantly, track – how well your process improvement strategies are working. It also offers tips on leveraging data metrics to ensure the smooth implementation of your initiative.
You’ll gain critical insights about the prime factors that could be inhibiting effectiveness in flow management, as well as uncover hidden opportunities or flows that may exist but have not yet been noticed — all within a single solution!
Become the best version of yourself—both in terms of leading teams AND managing processes better. Read on now and take charge of change with Kanban Charts.
What Are Kanban Charts?
Kanban charts are visual tools that you can use to manage your work more effectively. They provide a clear and concise overview of your work status by illustrating what particular tasks must be done, what’s currently being worked on, and what has already been completed.
Originating from Japan, “Kanban” translates to “billboard” or “signboard.” This method promotes continuous collaboration and encourages active, ongoing learning and improvement by visually mapping out your workflow.
As you implement this tool, you’ll find it easier to identify bottlenecks, track progress, and enhance overall productivity.
Why Should You Incorporate the Kanban Method?
Kanban boards may be your solution if you’ve ever felt overwhelmed with juggling multiple tasks or projects.
These Kanban boards provide a clear visual representation of your workflow, making it easier for you to prioritize tasks and keep track of progress. Kanban project management methodology lets you see bottlenecks and inefficiencies at a glance, allowing you to address these issues promptly.
Using the Kanban board allows you to manage your workload more efficiently, reduce stress, and enhance productivity.
Now that you understand the value of incorporating the Kanban board method into your business let’s delve deeper into the different types of Kanban charts available.
Each has its unique features and benefits, offering solutions tailored to various business needs.
Read on to discover how these charts can transform your approach as a project manager and workflow organization.
What Are The Different Types of Kanban Charts?
Understanding and utilizing Kanban charts could be the game-changer you need. Let’s unpack the different types of Kanban charts at your disposal.
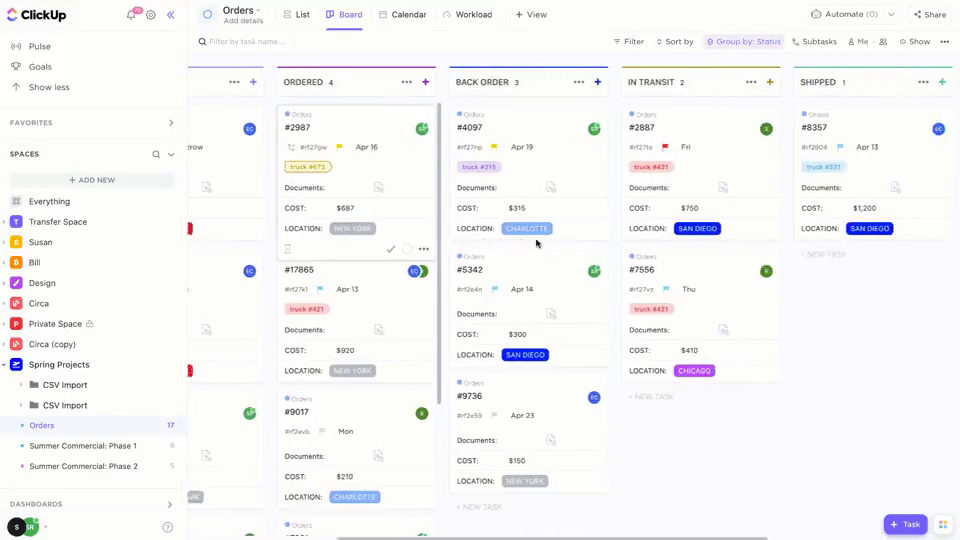
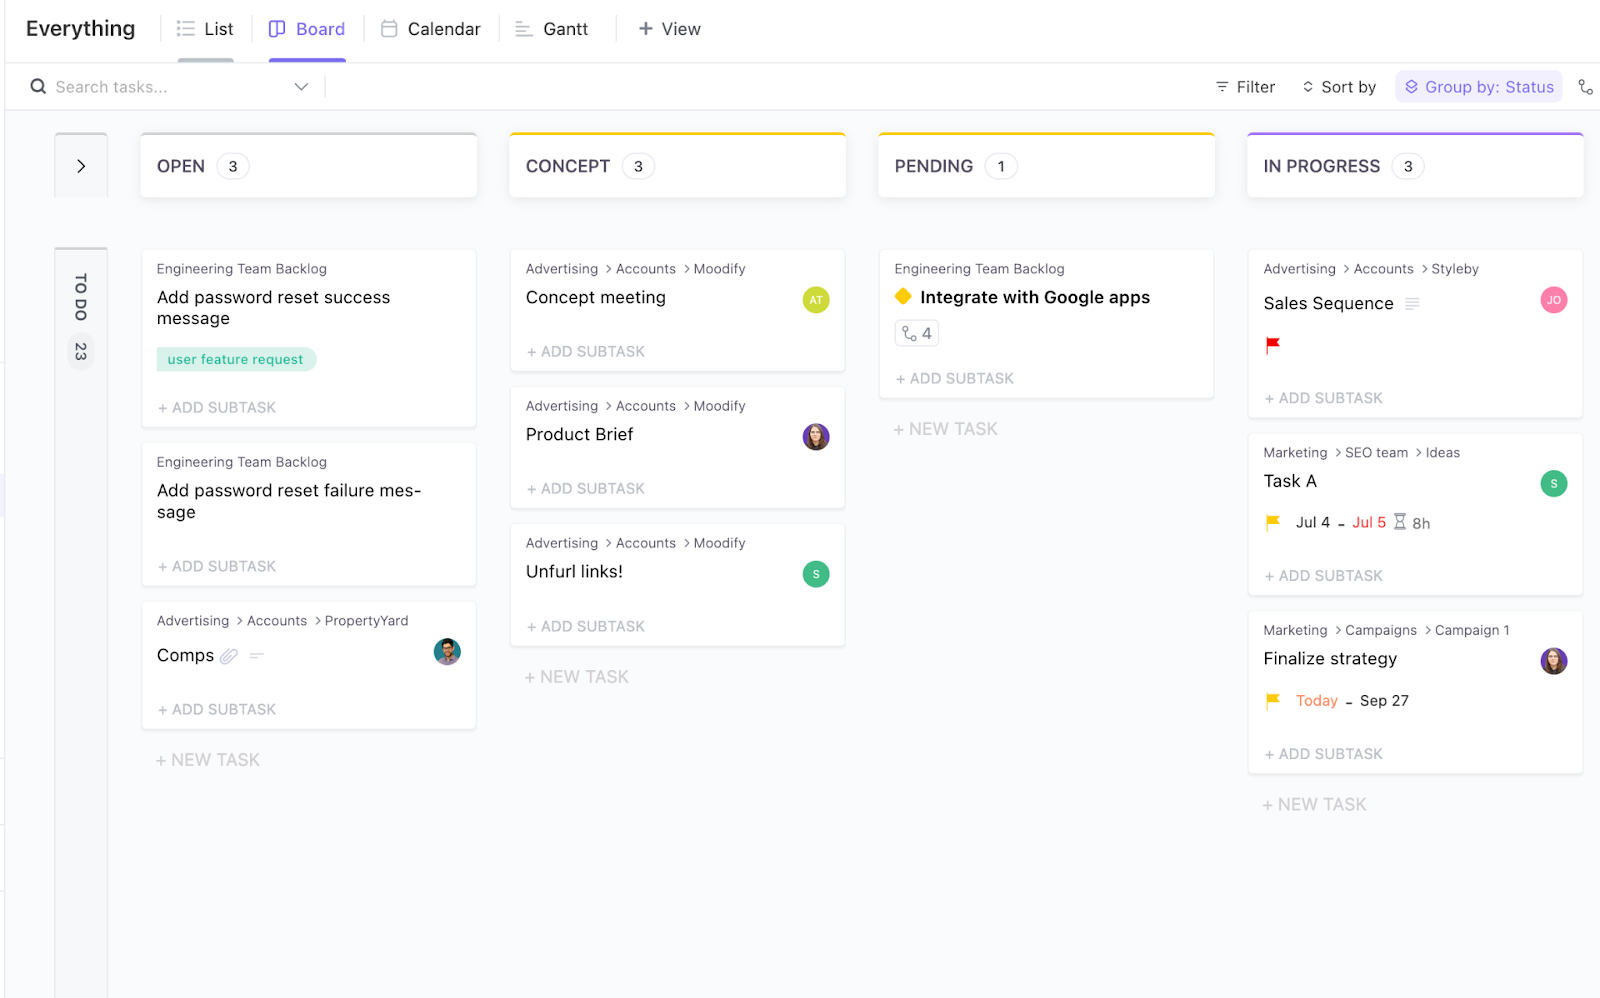
#1) Kanban Boards
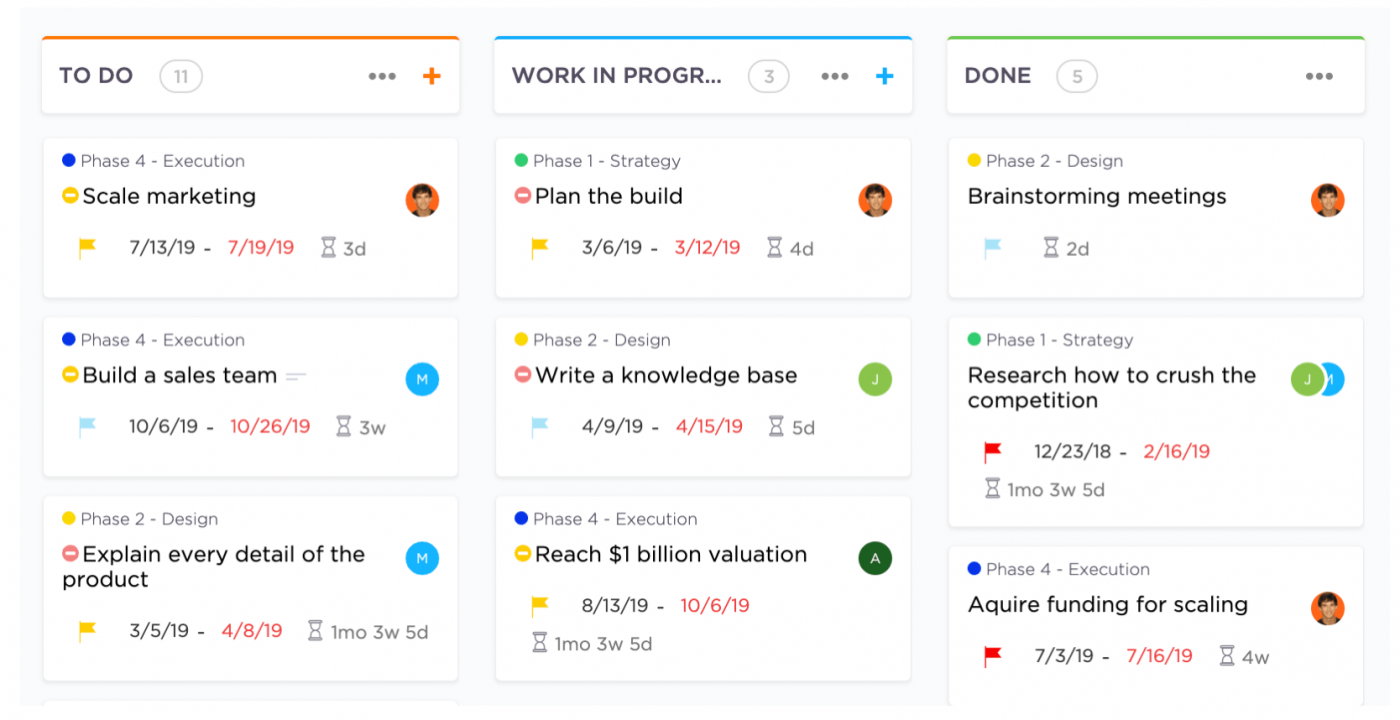
A Kanban board is a tool that visually depicts your workflow, enabling you to manage and monitor your projects more effectively. It consists of multiple columns representing different stages of a task, from inception to completion.
As tasks progress, their corresponding cards move across the board. The Kanban board system enhances transparency and allows for quick identification and resolution of any bottlenecks or delays in your process.
#2) Burndown Chart
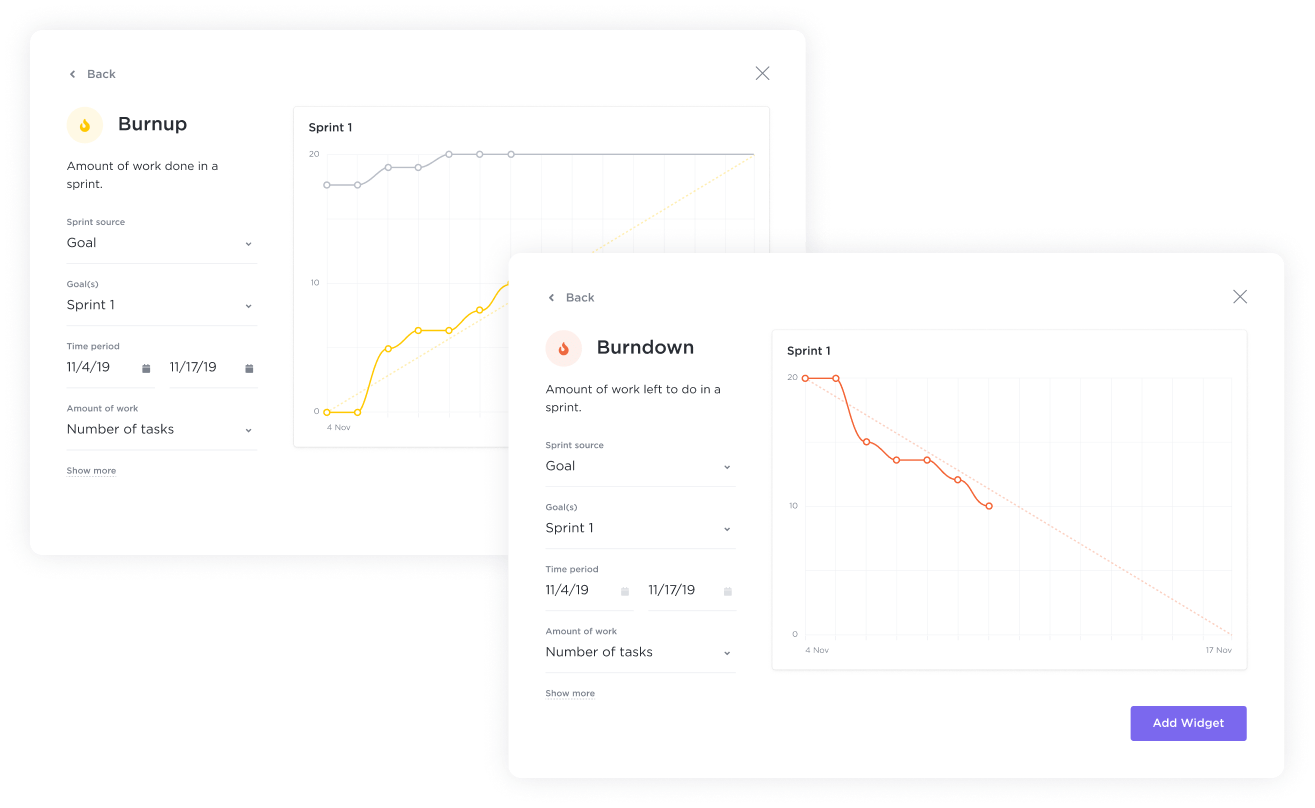
The Burndown Chart is a graphical representation of work left to do versus time. It’s a powerful tool that gives you an overview of project progress and remaining work. With a quick glance, you can see if you’re on track to complete your tasks within the designated time frame.
If the chart shows a deviation from the projected timeline, it signals that adjustments may be needed to stay on course. This invaluable insight allows you to manage your workflow and maintain efficiency proactively.
#3) Lead Time & Cycle Time Chart
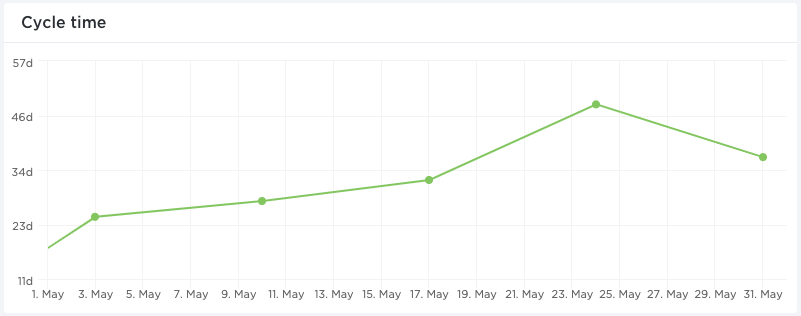
The Lead Time and Cycle Time Chart is a dynamic tool that helps you measure efficiency. Lead Time refers to the total time from when a task is created until it’s completed, whereas Cycle Time measures the time taken to complete a task once work has begun on it.
Tracking these two metrics lets you identify how quickly tasks are moving through your process and where delays might occur. Lead time and cycle time charts allow you to make necessary adjustments to improve productivity and maintain steady progress in your workflow.
#4) Cumulative Flow Diagram (CFD)
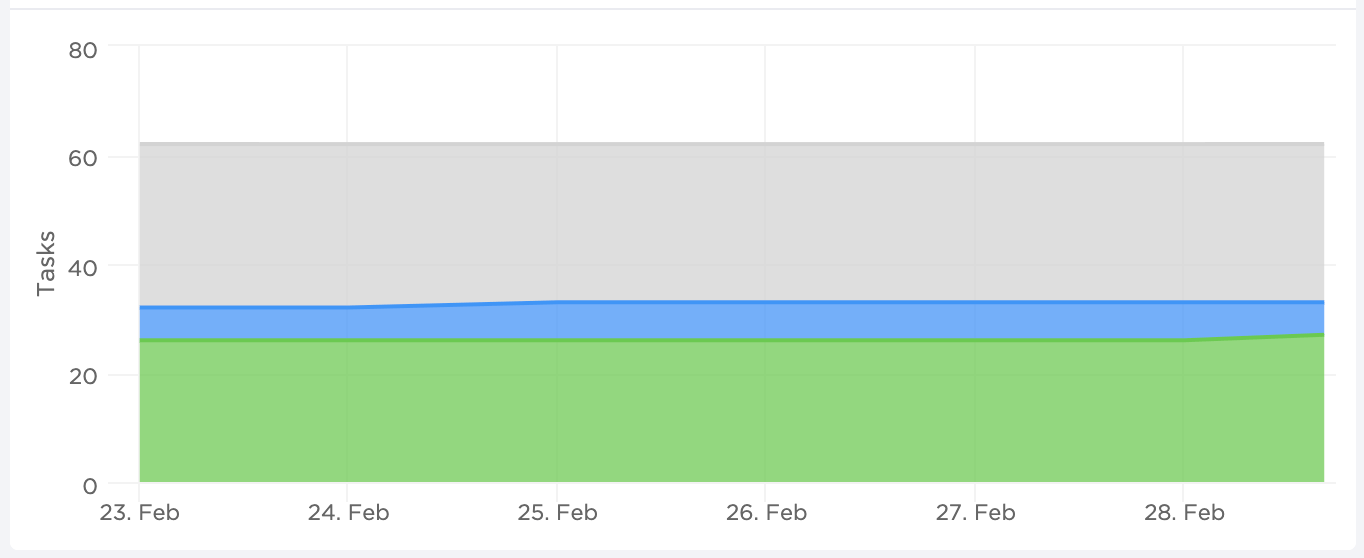
Cumulative Flow Diagram (CFD) is a valuable tool in your Kanban arsenal. A CFD provides you with a visual representation of the status of your work over time. The diagram is divided into different colored bands, each representing a stage in your workflow. The width of the band indicates how many tasks are in that stage at any given time.
By observing the flow and any widening or narrowing of these bands, you can spot potential bottlenecks or delays in your process. This allows you to intervene and adjust your workflow, ensuring a smooth and efficient progression of tasks.
#5) Cycle Time Scatter Plot
The Cycle Time Scatter Plot is another powerful tool for your business process management. This comprehensive chart tracking system plots the completion of each task over time, with the vertical position of each point representing the cycle time of that task. You can identify patterns and trends in your workflow by analyzing the scatter plot.
For instance, seeing a cluster of points at a higher cycle time might indicate a consistent delay in specific tasks. This allows you to pinpoint issues and implement continuous improvement, optimizing your workflow for better efficiency and productivity.
#6) Aging WIP Chart
The Aging Work-in-Progress (WIP) Chart is a strategic tool to manage your ongoing tasks effectively. In this chart, each task is plotted according to how long it has been in its current workflow stage.
You can use a WIP limit for each member per project to ensure you are all on the right track. The horizontal axis represents time, and the vertical axis represents the number of days each task has remained in its current state.
This chart enables you to identify all the tasks that have been stagnating or taking longer than expected, which could potentially be a sign of underlying issues. Addressing these tasks promptly and with a WIP limit per team member can prevent bottlenecks and ensure a more fluid and productive workflow.
#7) Distribution Chart
A Distribution Chart is a type of data visualization that shows how often different values or ranges of values occur within a set. It’s beneficial for understanding the spread and skewness of your data set and whether it has any outliers.
This chart can be presented in various forms, such as histograms, box plots, violin plots, bee swarms, or density plots. Each form provides a unique perspective on the distribution of the data.
#8) Blocker Clustering or Block Resolution Chart
Blocker Clustering or Block Resolution Chart is a tool that helps you understand and address obstacles impeding your workflow.
By categorizing and visualizing these blockers, you can identify patterns and trends, which can aid in devising strategies to eliminate or mitigate them, thereby smoothening your process flow.
#9) Flow Efficiency
Flow Efficiency is a critical metric in Kanban and Lean methodologies. It measures the proportion of time that work items spend actively being worked on versus the total time from start to finish, including both active and wait times.
The higher the flow efficiency, the less time tasks spend waiting.
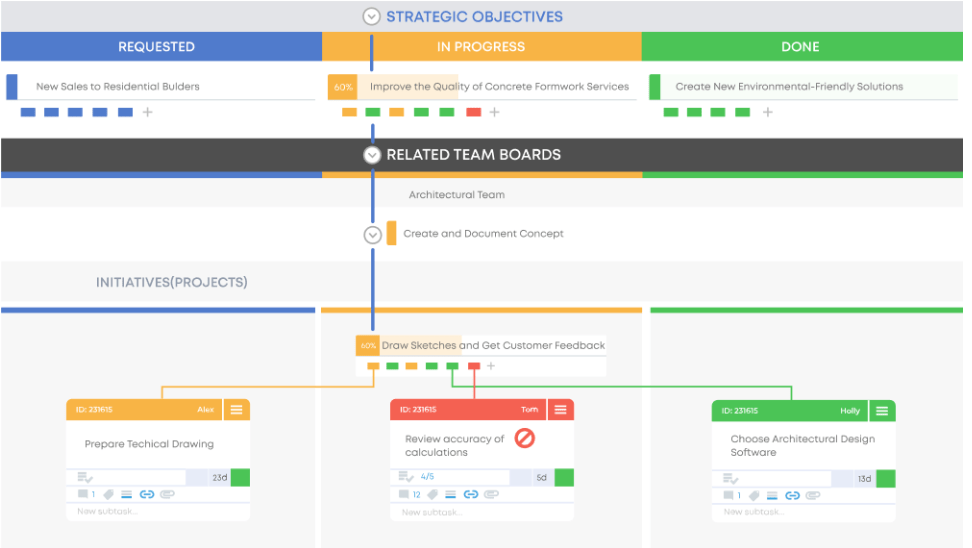
#10) Kanban Timeline
A Kanban Timeline is a visual representation of your workflow using a Kanban board, where each column represents a stage in the process, and cards move from left to right as they progress through these stages.
This timeline allows you to see the status of all tasks at a glance, identify bottlenecks, and monitor the overall health of your project.
Key Considerations For Successfully Using Kanban Charts
Using Kanban charts can revolutionize how you manage projects and workflows. However, successful implementation requires more than just tracking progress and completed tasks. You must ensure that your Kanban chart reflects the real-time state of your work and is consistently updated.
Consider experimenting with different types of Kanban charts, such as Distribution Charts, Blocker Clustering or Block Resolution Charts, Flow Efficiency graphs, and Kanban Timelines. Each type offers unique insights that can help identify areas of continuous improvement in your workflow.
Remember, the ultimate goal of using a Kanban chart is to improve your workflow. Use it to identify bottlenecks, recognize patterns, and guide decision-making. Never underestimate the power of visualization; a well-structured Kanban chart can provide a concise view of your project status, enabling you to respond quickly to changes.
Also, remember that Kanban is flexible – feel free to adapt it to suit your team’s needs and working style.
How To Use Key Kanban Charts For Your Kanban Workflow
As you begin to implement Kanban charts in your workflow, remember that they are more than just task trackers. They are powerful visual tools that can offer insights into your process and help drive improvements.
Regularly update your Kanban board to reflect the real state of your work, and don’t shy away from experimenting with different types of Kanban charts. Whether it’s a Distribution Chart, Block Resolution Chart, Flow Efficiency graph, or a Kanban Timeline, each can provide unique perspectives on your workflow.
Beyond the scope of this guide, there are several ways to enhance your use of Kanban charts.
- Leverage the visual nature of these charts to foster greater transparency and communication within your team. Having a clear view of the workflow can help everyone understand their role in the process and how their work impacts the whole.
- Consider integrating your Kanban system with other project management or productivity tools you’re using. This could streamline your processes further, making it easier to manage tasks and track progress.
- Lastly, remember that the power of Kanban lies in its flexibility. Don’t hesitate to adapt and modify the system as your Kanban teams grow, your projects evolve, and your needs change.
Get The Right Kanban Tools: ClickUp
As you venture into the world of the digital Kanban board, having the right tools, like ClickUp, can be a game-changer. ClickUp’s intuitive interface and flexible features make it an ideal Kanban system implementation platform. It allows you to visualize tasks, track progress, and manage workflows effectively.
There are ways to harness the full power of ClickUp and enhance your Kanban experience.
- Explore the integrations ClickUp offers. Linking ClickUp with other tools you use can help streamline your processes, reduce redundancies, and save lead time.
- Leverage ClickUp’s collaborative features. Share Kanban boards with your team, assign tasks, and use the comment feature to facilitate communication. This can foster transparency and keep everyone on the same page.
- Lastly, remember that ClickUp, like Kanban itself, is highly adaptable. Feel free to customize your Kanban boards, lists, and cards to suit your specific needs. Remember, the goal is to create a system that works for you and enhances your productivity.
Final Thoughts on Kanban Charts
As you conclude your journey of integrating Kanban methodology into your business systems, it’s important to recognize their transformative impact.
Kanban charts are not just tools for organizing tasks; they’re powerful instruments that can significantly enhance your workflow’s clarity, efficiency, and productivity.
They allow you to visually map out a Kanban process, track real-time progress, and promptly identify bottlenecks, enabling you to make informed decisions quickly.
My experience implementing Kanban charts in various business settings has consistently demonstrated their effectiveness in streamlining operations and boosting Kanban team collaboration. This hands-on experience and a deep understanding of diverse business needs position me to offer practical and impactful insights.
The strategies and tips shared in this tutorial are drawn from real-world applications, ensuring that the advice you receive is theoretical, tested, and proven in actual business environments.
Remember, the key to successful system implementation is continuous adaptation and improvement. As your business evolves, so should your systems.
Embrace the dynamic nature of Kanban charts, and don’t hesitate to adjust them to suit your changing business needs better.
And if you’re seeking more personalized advice or advanced strategies, know I am here to guide you further in optimizing your business processes. Together, we can elevate your operational efficiency to new heights!