
Kanban Metrics: The Ultimate Guide To Measuring Your Kanban Efforts
Are you trying to measure the effectiveness of your Kanban efforts?
If so, then kanban metrics is the perfect tool for you!
With this ultimate guide, I’ll show you exactly how to measure all aspects of your processes — from delivery times and work-in-progress limits to cycle times and more — so that you can make informed decisions for improvement!
Get ahead of the game with enhanced insights that empower your business team to improve their overall workflow metrics efficiency!
You’ll gain real visibility over bottlenecks in process flows by leveraging methods such as data visualizations from powerful analytics tools – putting YOU at the center of success for any application you create!
Check out this guide to understanding Kanban metrics today and start measuring your team’s efforts more effectively!
What Is The Kanban System?
The Kanban system is a visual workflow management method that helps teams continuously deliver value through a pull-based process. It originated in manufacturing at Toyota.
Since then, project managers adapted to various industries and tasks, including software development, marketing, and personal goal setting.
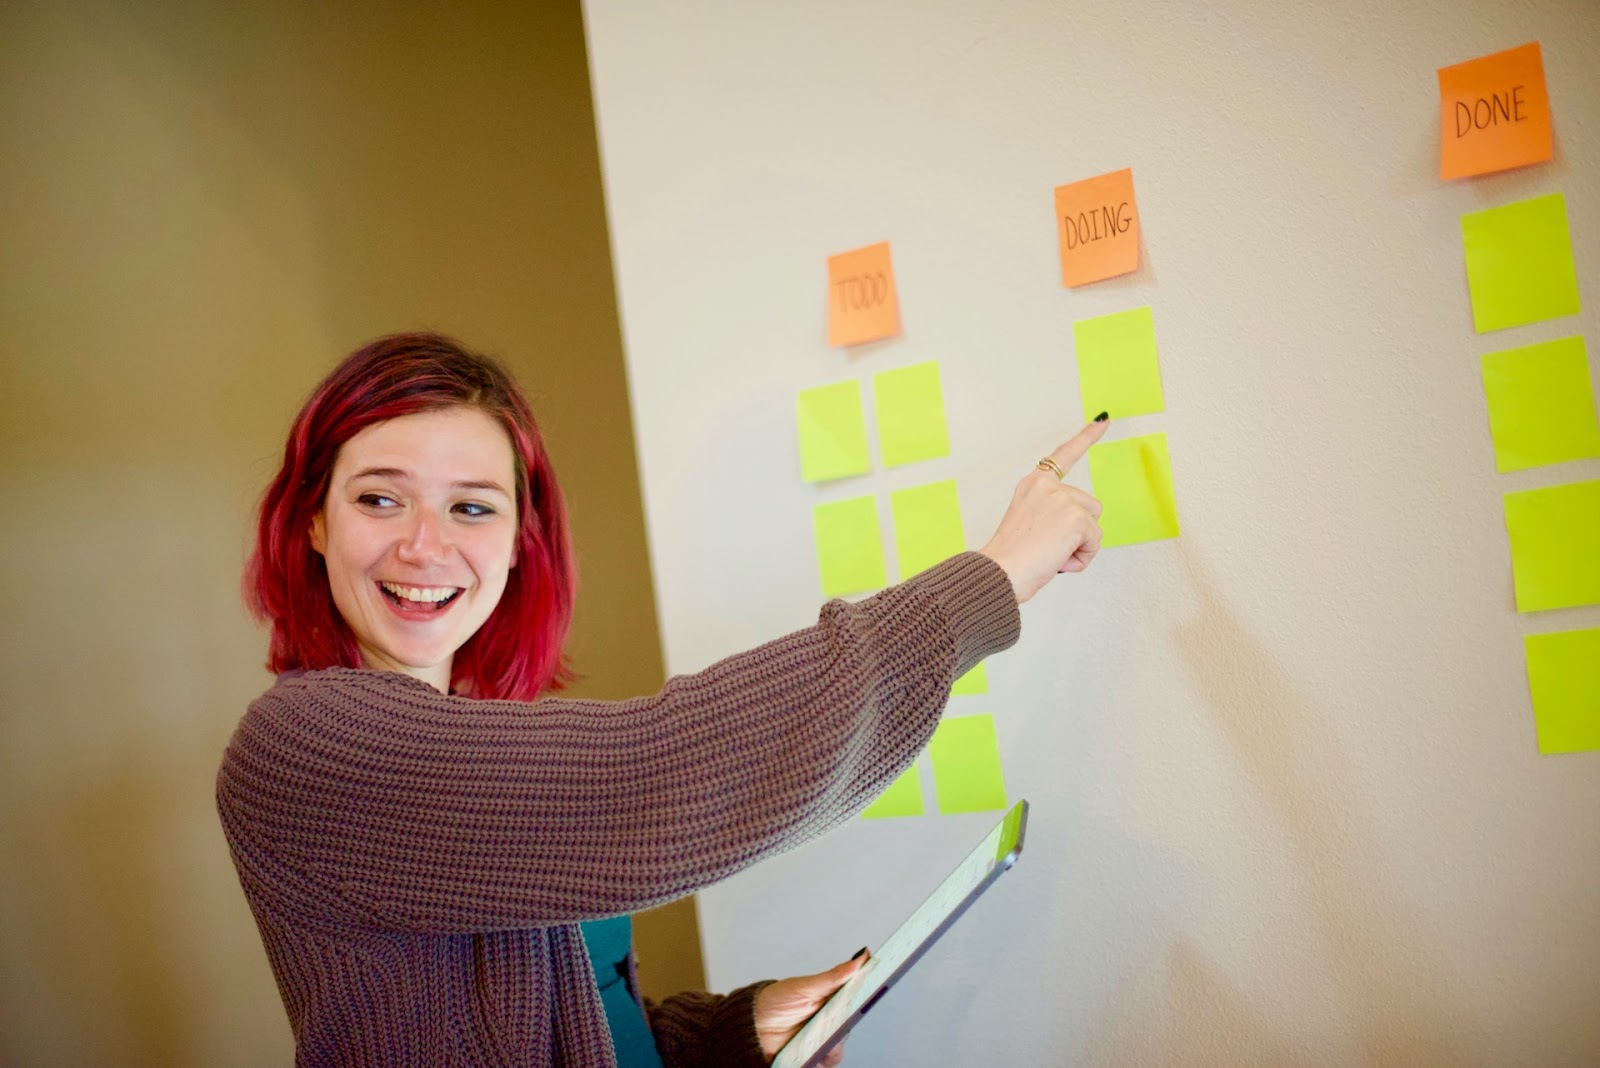
What Is A Kanban Board?
A Kanban board is the heart of the Kanban system, acting as a visual map of your workflow. It’s like a real-time snapshot of everything your team is working on at a glance.
Think of it as a whiteboard or online tool divided into columns, each representing a distinct stage in your process. Here’s how it works:
- Cards: Individual tasks, represented by cards, move through the columns as they progress from “To Do” (e.g., new ideas) to “In Progress” (actively being worked on) and finally to “Done” (completed).
- Columns: These depict the different stages of your workflow, tailored to your specific process. Common examples include “To Do,” “In Progress,” “In Review,” “Testing,” and “Done.” You can customize these to fit your needs, like adding “Backlog” for future ideas or “Blocked” for how many tasks are facing roadblocks.
- WIP limits: Each column has a designated maximum number of cards, called the WIP limit. This prevents overloading your team and ensures work flows smoothly. Imagine traffic lights on your board, letting work items flow freely when green (under the limit) but stopping them when red (exceeding the limit).
Think of a Kanban board as a dynamic dashboard, constantly communicating where your work stands and keeping everyone on the same page. It’s a central hub for collaboration, transparency, and achieving optimal workflow in your Kanban system.
Why You Should Measure Key Kanban Reporting Metrics?
Understanding and measuring key Kanban metrics is crucial in managing the workflow effectively and enhancing your team’s future performance. These metrics offer insights into how your process is running, help identify potential bottlenecks, and highlight areas for improvement.
They provide a quantifiable measure of your team’s efficiency, enabling you to track progress over time and make data-driven decisions.
Now that we’ve established the importance of measuring Kanban metrics, let’s delve into these metrics and how they can improve your Kanban efforts. The following list will guide you through the most critical metrics to consider when implementing or refining your Kanban system.
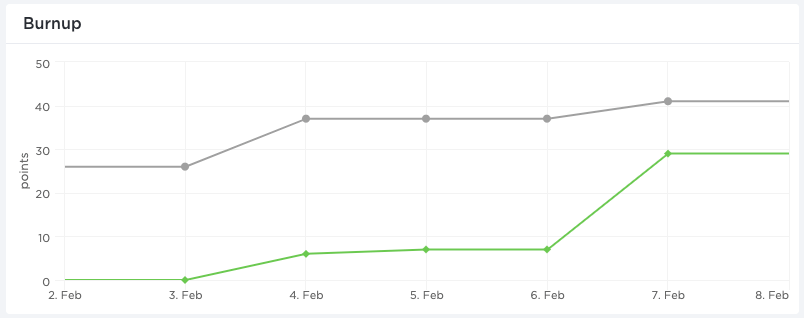
Burndown Chart
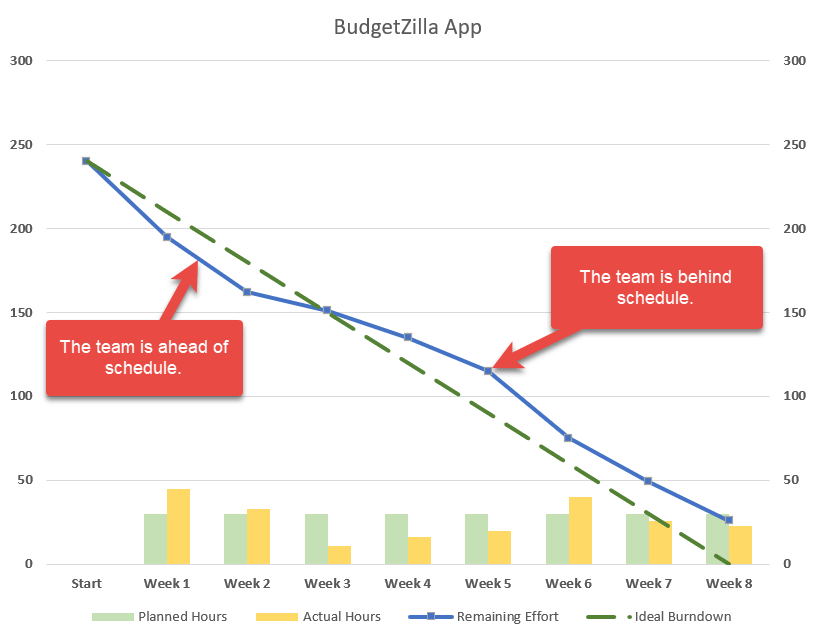
A Burndown Chart is a graphical representation used in Kanban (and other agile methodologies) to track work progress over time. This chart is handy for visualizing the amount of work remaining in a project or a specific time frame, such as a sprint.
It typically displays two key metrics:
- Time: This is often shown on the horizontal axis, representing the duration of the project or sprint.
- Work Quantity: Shown on the vertical axis, this measures the amount of work that needs to be done, often in units like story points, hours, or task count.
As tasks are completed, the chart shows a downward trend, indicating the ‘burning down’ of work. The ideal trajectory is a steady downward slope towards zero, meaning all planned work is completed by the end of the period. If the line deviates from this path, it signals potential issues in the workflow, such as delays or underestimation of work.
The Burndown Chart helps your team monitor their progress, manage time effectively, and adjust their strategies to ensure timely completion of projects. It also provides a clear visual communication tool for stakeholders to understand how a project is progressing.
Lead and Cycle Time Chart
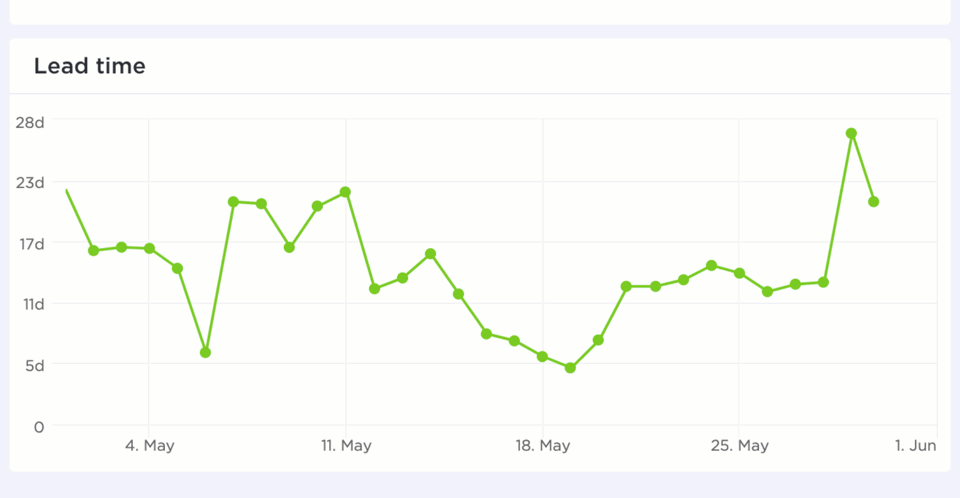
While the burndown chart gives you a bird’s-eye view of your sprint progress, understanding how individual tasks flow through your Kanban board is equally crucial. This is where the Lead Time and Cycle Time Chart come in, acting like a microscope for examining the inner workings of your workflow.
Lead Time
This measures the time it takes for a task to be completed after it’s initiated. Understanding how long it takes to deliver a piece of work from start to finish is crucial.
Cycle Time
Cycle time tracks how long it takes for work to be completed once it’s actually started. It’s a more specific measure than lead time as it focuses solely on the time spent working on the task, excluding any wait time before the task is started.
Throughput
This metric counts the number of work items completed in a certain period of time. High throughput indicates a high level of productivity.
Work In Progress (WIP) Limits
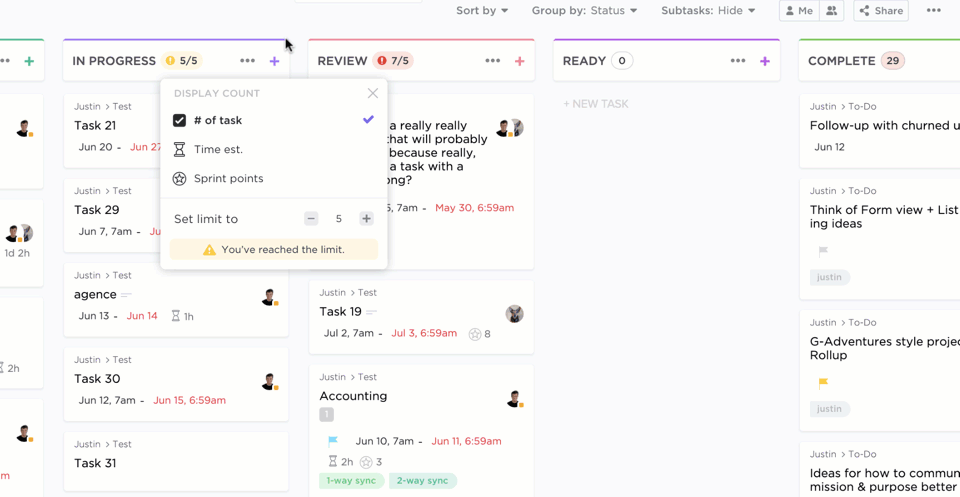
WIP limits control the number of tasks in progress at any given time. They help manage workflow and ensure that teams only take on what they can handle, which can lead to bottlenecks.
Team Performance
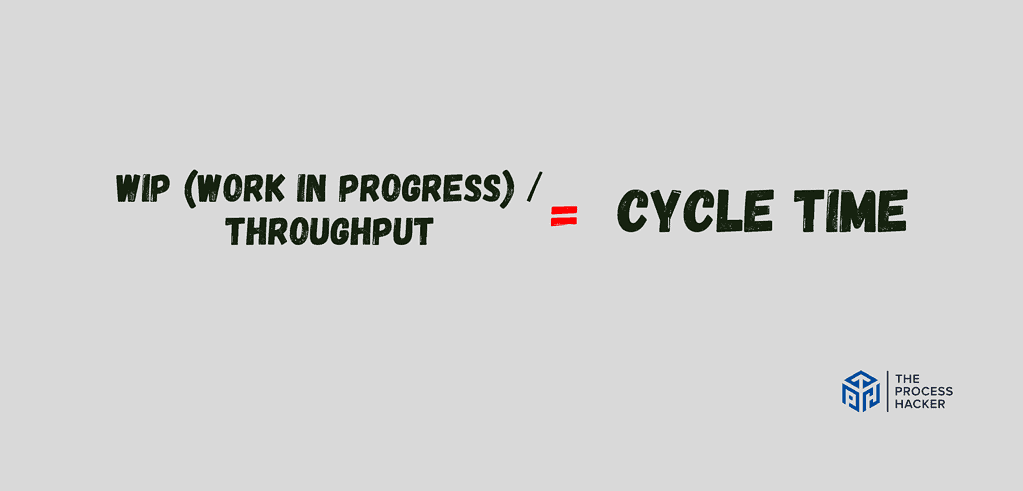
While individual metrics like burndown charts and lead times offer valuable insights, understanding team performance requires a more holistic approach.
Let’s break it down:
- WIP (Work in Progress): This represents the average number of tasks your team works on at any given time. Think of it as the number of plates your team is juggling.
- Throughput: This measures the average number of tasks your team completes in a specific timeframe, often a sprint or week. Imagine it as the number of plates successfully landed and cleared.
- Cycle Time: This, as we discussed earlier, reflects the average time it takes for a task to flow through your entire Kanban system, from initiation to completion. Think of it as the average cycle time to juggle one task and put it down.
Now, why is this equation crucial? It reveals the intricate relationship between:
- Workload and efficiency: A high WIP might lead to longer cycles as tasks compete for resources and attention.
- Team capacity and flow: Low throughput with high WIP suggests your team might be overburdened or encountering roadblocks.
- Process optimization and value delivery: Balancing WIP and throughput effectively minimizes average cycle time, ultimately speeding up customer value delivery.
Cumulative Flow Diagram (CFD)
While the metrics we’ve discussed so far provide valuable data points, sometimes you need a broader picture to understand your workflow’s health truly. That’s where the Cumulative Flow Diagram (CFD) comes in.
Think of it as a detailed map of your Kanban system, revealing how work flows through each stage over time. Imagine a chart with:
- X-axis: Representing time (days, weeks, etc.)
- Y-axis: Representing the number of tasks in each stage of your workflow (e.g., “To Do,” “In Progress,” “Done”)
- Colored Lines: Each line represents a different stage, accumulating vertically as tasks progress.
Interpreting a CFD can provide valuable insights into your team’s performance and process efficiency. For instance, if the layers are widening over time, it suggests that work is piling up faster than it’s being completed, indicating a potential bottleneck.
On the contrary, if the layers are narrowing, it implies that tasks are being completed faster than new ones are added, suggesting an efficient process.
An adequately maintained CFD can help teams identify bottlenecks, monitor changes in their workflow, and make data-driven decisions to improve their performance and efficiency.
Cycle Time Control Chart
While the Cumulative Flow Diagram offers a visual panorama of your workflow, the Cycle Time Control Chart zooms in on a specific metric – cycle time – and analyzes its stability over lead time. Think of it as a microscope for examining the heartbeat of your Kanban system.
The Cycle Time Control Chart is a crucial metric in Kanban that provides detailed insights into the variability and stability of a team’s capacity and workflow. It is a visual tool that plots the average cycle time of each work item against the time it was completed, offering a clear view of the process performance over a selected period.
Remember, a Cycle Time Control Chart is not a standalone tool but a valuable addition to your Kanban metrics toolkit. Use it with other metrics like CFD and WIP/Throughput to understand your workflow health comprehensively and identify areas for continuous improvement.
Blocker Clustering

While monitoring flow and individual task metrics is crucial, understanding what hinders your team’s progress is equally important. That’s where blocker clustering comes in, acting like a detective uncovering the underlying patterns behind recurring roadblocks.
Blocker clustering analyzes data on these roadblocks, helping you:
- Identify recurring patterns: Discover the most frequent types of blockers your team faces. Are they dependencies, unclear requirements, or technical issues?
- Pinpoint specific bottlenecks: Uncover stages in your workflow where blockers consistently arise, indicating potential process flaws or resource constraints.
- Prioritize improvement efforts: Focus on addressing the most impactful blockers affecting overall flow and value delivery.
- Track progress and measure effectiveness: Monitor the frequency and type of blockers over time to evaluate the effectiveness of implemented solutions.
Remember, the goal of blocker clustering isn’t just to solve individual blockers but to uncover and address the root causes of these impediments. By doing so, teams can reduce the occurrence of blockers, improve workflow efficiency, and ultimately deliver value faster.
Bottlenecks
Identifying and managing bottlenecks in the Kanban method is crucial for maintaining an efficient workflow. Bottlenecks occur when a particular stage in the workflow consistently slows down the overall process, leading to delays and decreased productivity.
Understanding and addressing these bottlenecks is vital for optimizing workflow and ensuring the Kanban system operates effectively.
Bottlenecks can be identified by observing each workflow stage’s work-in-progress (WIP). If a certain stage consistently has a higher WIP than other stages, it’s likely a bottleneck. Tools like the Cumulative Flow Diagram (CFD) can also help visualize bottlenecks. In a CFD, a widening band indicates a growing queue of tasks, suggesting a bottleneck.
Once a bottleneck is identified, the next step is to find ways to alleviate it. This could involve reallocating resources, improving skills, or changing the process. It’s important to remember that simply pushing more work through the bottleneck without addressing the underlying issue can lead to lower-quality output and increased stress for the team.
By actively managing bottlenecks, teams can improve workflow efficiency, reduce cycle times, and deliver value to customers more quickly and reliably.
Flow Efficiency
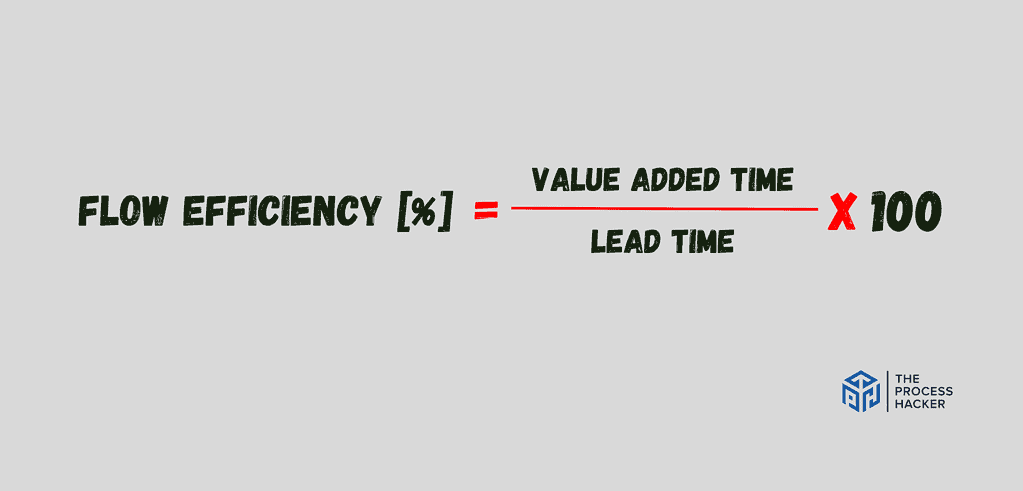
Flow efficiency is the beating heart of your Kanban system, reflecting the percentage of time work actively moves towards completion. It’s like a speedometer for your workflow, revealing how much time is spent truly adding value and how much is wasted on delays, rework, or waiting.
The formula for calculating flow efficiency is:
- Flow Efficiency = (Active Time / Total Time) * 100%
- Active Time: The time spent actively working on a task.
- Total Time: The total time from when a task enters the workflow until it’s completed, including both active and waiting times.
A high flow efficiency indicates that tasks spend a large portion of their lead time and cycle time being actively worked on, while a low flow efficiency suggests that tasks spend a substantial amount of time waiting or blocked.
Analyzing flow efficiency helps teams identify where work is getting stalled and where there’s room for improvement. It’s important to note that while achieving 100% flow efficiency might seem like an ideal goal, it’s often not practical or desirable as it could lead to burnout or compromise the quality of work.
Improving flow efficiency involves reducing wait times and eliminating waste in the workflow. This can be achieved by balancing workload, limiting work-in-progress, removing blockers promptly, and continuously optimizing the process.
Aging Work in Progress
Aging WIP refers to tasks that have been in progress on your Kanban board for an extended period, exceeding expected processing times for a specific stage. Think of cards accumulating dust in the “In Progress” column, hinting at hidden roadblocks or inefficiencies.
A high Aging WIP value may indicate that tasks are getting stuck or delayed in your workflow, potentially due to bottlenecks, blockers, or imbalances in workload distribution. On the other hand, a low Aging WIP value suggests that tasks are being completed efficiently and swiftly.
Monitoring Aging WIP can help your team identify potential issues early on and take corrective actions before significantly impacting your project’s timeline or quality. It can also help you understand trends over time and make data-driven decisions about process improvements.
Key Considerations For Successfully Using Kanban Metrics
When using Kanban metrics, it’s important to remember that the ultimate goal is not to achieve perfect scores in all metrics but to create a sustainable and efficient workflow that delivers value to customers. Metrics should be used to identify improvement areas and monitor the impact of changes, not as targets to hit at all costs.
Another key consideration is the context. The same metric can have different implications depending on the nature of the work, the team’s capabilities, and other contextual factors. Therefore, it’s crucial to interpret metrics in the context of your specific situation and goals.
Finally, keep in mind that Kanban metrics are most effective when used in combination. Each metric provides a different perspective on the workflow, giving a more comprehensive understanding of the system’s performance. Regularly reviewing key metrics can help teams maintain a balanced view and make informed decisions about process improvements.
How To Use Key Kanban Metrics For Your Kanban Workflow
To effectively enhance and optimize your Kanban workflow using key metrics, it’s important to integrate these metrics into your regular process review and decision-making routines.
- Regular Reviews and Adaptation: Implement a routine of regular reviews (such as weekly or bi-weekly) where the team analyzes the key metrics to assess the health and efficiency of the workflow. Use these insights to make informed decisions about process adjustments. For instance, if the Cycle Time Control Chart indicates increasing cycle times, investigate potential causes and consider strategies to address them, such as redistributing workload or removing non-essential steps.
- Goal Alignment: Ensure the metrics you track to align with your broader organizational goals and objectives. For example, if customer satisfaction is a priority, closely monitor metrics like lead time and flow efficiency to ensure your workflow responds to customer needs. Adjust your Kanban system to prioritize tasks or initiatives directly contributing to these goals.
- Continuous Improvement Culture: Foster a culture of continuous improvement within your team. Encourage team members to suggest improvements based on their observations of the metrics. This not only helps in optimizing the workflow but also boosts team engagement and ownership of the process. Engage in regular brainstorming sessions where team members can discuss metric trends and collaboratively develop solutions to enhance workflow efficiency.
You create a dynamic, responsive, and continuously improving process by actively using Kanban metrics for your workflow management. This proactive approach ensures that your Kanban system remains effective and aligned with your team’s evolving needs and goals.
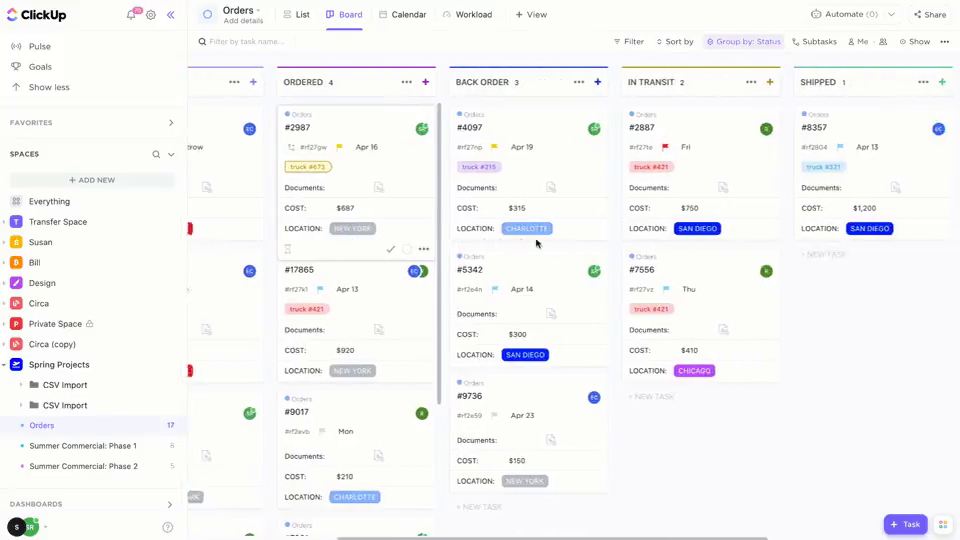
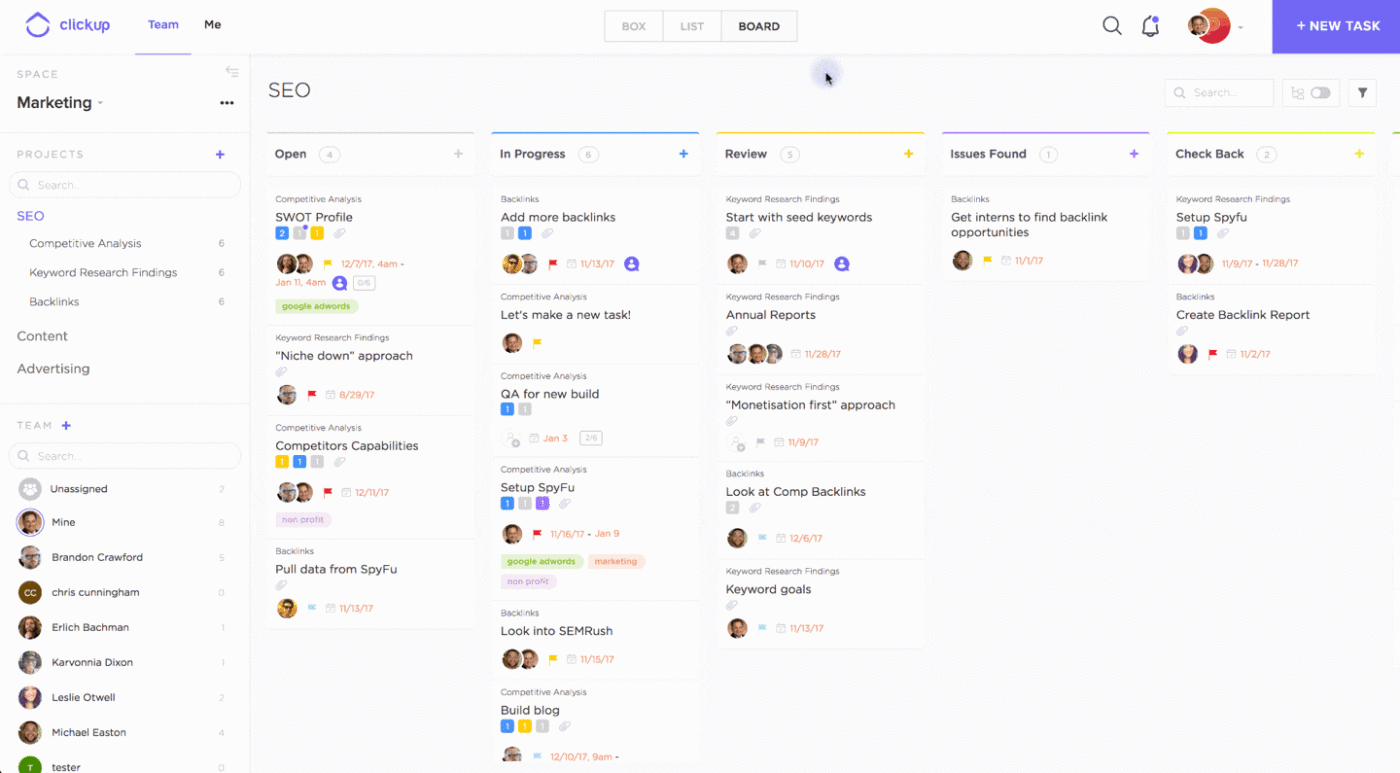
Get The Right Kanban Tools: ClickUp’s Board View
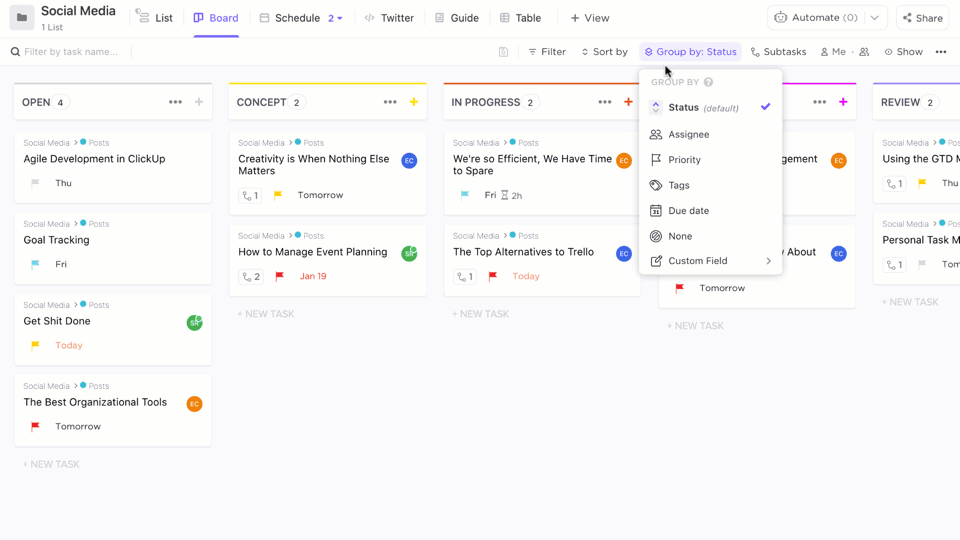
Investing in the right Kanban tools is crucial to implement and manage your workflow effectively, and ClickUp is one such tool that can significantly enhance your Kanban efforts. ClickUp provides a flexible and intuitive platform for creating and managing Kanban boards, making it easy to visualize your workflow, track tasks, and monitor progress.
ClickUp’s powerful features allow you to customize your Kanban board to suit your team’s needs. You can create custom tags, add detailed task descriptions, assign tasks to team members, set due dates, and more. This level of customization makes it easier to manage complex projects and ensures everything runs smoothly.
Furthermore, ClickUp’s collaboration features make it easy for teams to work together efficiently. Team members can comment on tasks, share files, and collaborate in lead time, ensuring everyone stays aligned and informed. Leveraging ClickUp’s capabilities can improve your Kanban workflow and foster better team collaboration and productivity.
Alternative KPIs: Important Metrics In Other Business Areas
In addition to Kanban metrics, businesses often use a variety of other Key Performance Indicators (KPIs) to track progress and measure success across different areas.
For example, customer satisfaction, average delivery time, service availability, and number of partners are key metrics related to business models that can provide valuable insights into how well the business is meeting its objectives.
Non-financial KPIs are another important category of metrics that focus on aspects not directly associated with monetary values. These could include measures of customer loyalty, employee engagement, brand recognition, or environmental impact, among others.
Such metrics can help businesses understand their performance in areas that, while not immediately impacting the bottom line, can significantly impact direct business value sustainability and growth.
Furthermore, operational metrics and KPIs allow businesses to measure the status of their operations and strategies. These include production process efficiency, supply chain management, quality control, and IT performance metrics.
By monitoring these metrics, businesses can identify operational bottlenecks, improve efficiency, and ultimately enhance their overall effectiveness and competitiveness.
Final Thoughts on Kanban Metrics
Mastering the art of Kanban metrics is a crucial step in optimizing your team’s performance and productivity. The four essential metrics—lead time, cycle time, work-in-progress, and average throughput —are fundamental tools for understanding your workflow’s efficiency and identifying areas for improvement.
Additionally, cycle times and average throughput are particularly effective in measuring team performance, providing insights into how quickly tasks are completed and how much work is delivered within a given timeframe. These metrics ensure that you are delivering results and meeting your objectives effectively.
Understanding and leveraging these metrics can significantly shorten your feedback loop, allowing for quicker adjustments and improvements to your workflow. Analyzing these metrics lets you stay on top of your team’s performance and continuously strive for process optimization.
This guide provides a comprehensive overview of these crucial Kanban metrics. My expertise in this area is backed by extensive research and experience, ensuring you receive accurate and actionable insights.
By implementing these strategies, you’ll be well-equipped to improve your Kanban workflow and boost your team’s overall productivity.