
Are you feeling overwhelmed with the amount of data in your marketing campaigns?
It’s tough to measure and track all the variables when managing successful marketing efforts. But that doesn't mean you can’t do something about it! We have made the ultimate guide for measuring these metrics so you don't feel alone or lost on your journey.
Our guide will provide step-by-step instructions on tailoring each metric toward your goals, helping you make smarter daily decisions. That means no more wasting time interpreting complex results - our tips and insights are here to help lead you and empower your team with a professional edge over competitors.
With this practical toolkit, you'll never again be stranded by confusing results or unsure where to start optimizing your campaigns! Get started today!
What Are Marketing Metrics?
Marketing metrics are a collection of numerical data that helps you assess the effectiveness and reach of your campaigns.
They provide tangible evidence about the success or failure of your strategies, allowing you to adjust and optimize for better results.
These metrics guide you toward your marketing goals, ensuring your efforts yield the desired outcomes.
Leading Marketing Metrics
Leading marketing metrics are those crucial indicators that serve as a benchmark for your marketing success. They include critical figures like conversion rates, customer acquisition costs (CAC), customer lifetime value (CLV), return on investment (ROI), and more.
By closely monitoring these metrics, you understand your marketing performance and strategically drive your efforts for maximum impact.
Lagging Marketing Metrics
Lagging marketing metrics are indicators that reflect the results of past marketing actions. These include total sales, market share, and customer retention rate. While they may not help to predict future outcomes, they provide valuable information about the effectiveness of your marketing efforts.
Why You Should Measure Key Marketing Metrics and KPIs
Measuring key marketing metrics and KPIs is paramount to your success. These numbers don't just represent data; they narrate the story of your marketing efforts, illustrating what's resonating with your audience and what isn't.
Here are some of the reasons why you should measure your key marketing metrics and KPIs:
- Storytelling Through Data: These metrics are more than just numbers; they tell the story of your marketing efforts and their impact on your audience.
- Enhanced Audience Understanding: Tracking these metrics allows you to understand your audience better.
- Campaign Optimization: You can optimize your marketing campaigns based on the insights from these metrics.
- Maximized ROI: Proper measurement and analysis of these metrics enable you to maximize your return on investment.
- Strategic Direction: This knowledge enables you to navigate the competitive market effectively.
- Deep Dive into Metrics: We emphasize the importance of understanding a complete list of marketing metrics and KPIs.
- Empowerment Through Knowledge: Understanding these metrics empowers you to harness their potential fully, driving your marketing efforts toward unparalleled success.
Understanding these metrics will empower you to fully harness their potential, driving your marketing efforts toward unparalleled success.
Social Media Marketing Metrics

When diving into social media marketing, it's crucial to understand the metrics that reflect your campaign's performance. These numbers indicate your brand's reach, engagement, and conversion on social media platforms.
Impressions
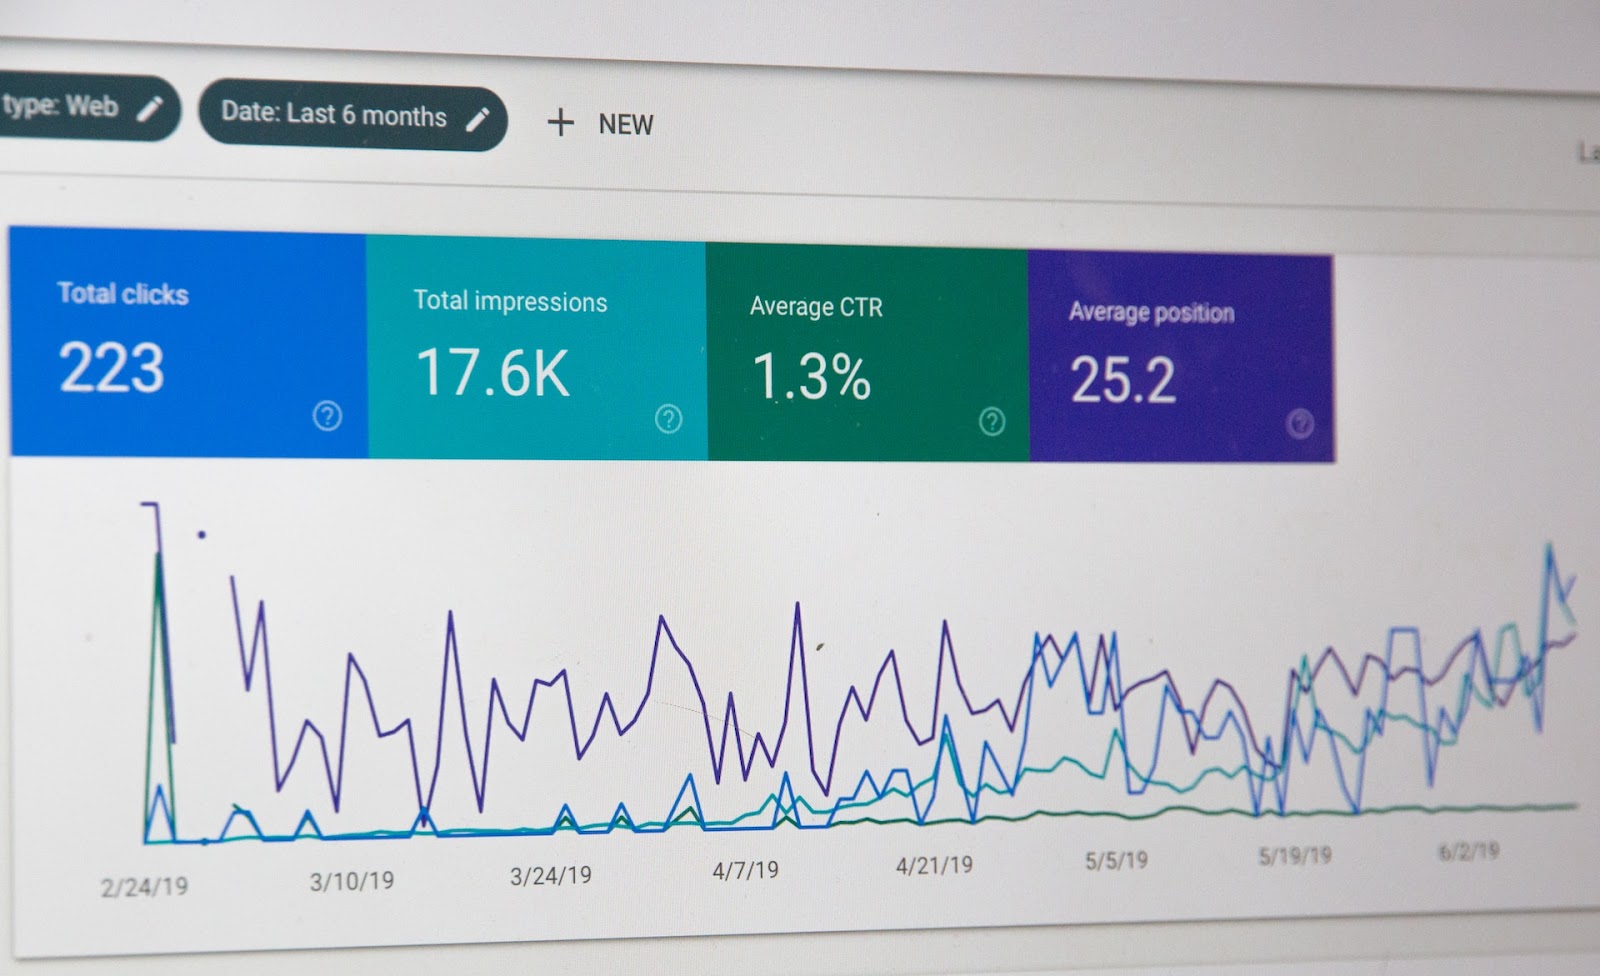
Impressions are the number of times your content is viewed on Google search or social media, like a digital billboard. They're essential for understanding the potential reach of your posts.
But remember, it's not the whole story. To get the full picture, pair it with other engagement metrics like clicks, likes, shares, or comments. This combo will give you a better idea of how your content is being seen and resonating with your audience.
Followers

Followers are the number of people who have chosen to connect with your social media profile and receive your updates. When someone follows your account, your posts appear in their news feed, increasing your content's visibility.
This metric indicates your brand's popularity and reach on social media. While a high follower count boosts your brand's image, remember that quality trumps quantity. A smaller, engaged audience interacting with your content is more beneficial than a large, inactive one.
Use this metric in conjunction with engagement metrics to ensure you're gaining followers and fostering meaningful interactions.
Social Media Engagement Rate
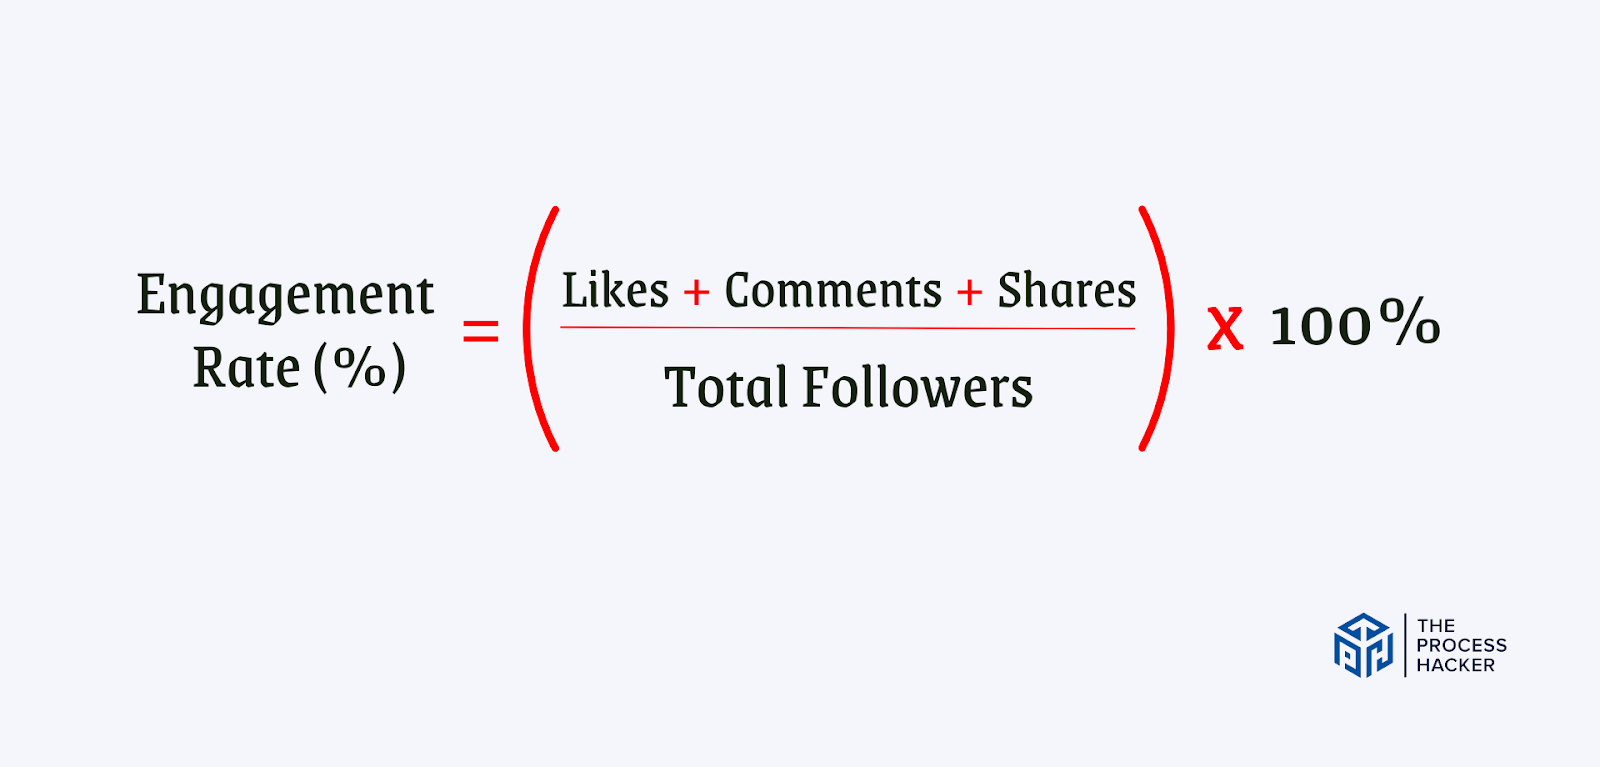
Engagement rate shows how much your audience is connecting with your content. It's calculated by dividing the total number of likes, comments, and shares by the number of followers and then multiplying it by 100 to get a percentage.
But remember, this metric isn't just about numbers - it's about understanding how much your content resonates with your audience. A high engagement rate means your content is really hitting the mark with your followers, getting them to join the conversation.
To support this growth, many brands also increase followers on Instagram as part of a broader strategy to strengthen visibility and reinforce their overall social presence.
By monitoring this metric, you can create more content your audience loves and less of what doesn't quite hit the mark. It's a beneficial tool for fine-tuning your social media strategy and ensuring that your audience stays engaged.
Audience Growth Rate (AGR)
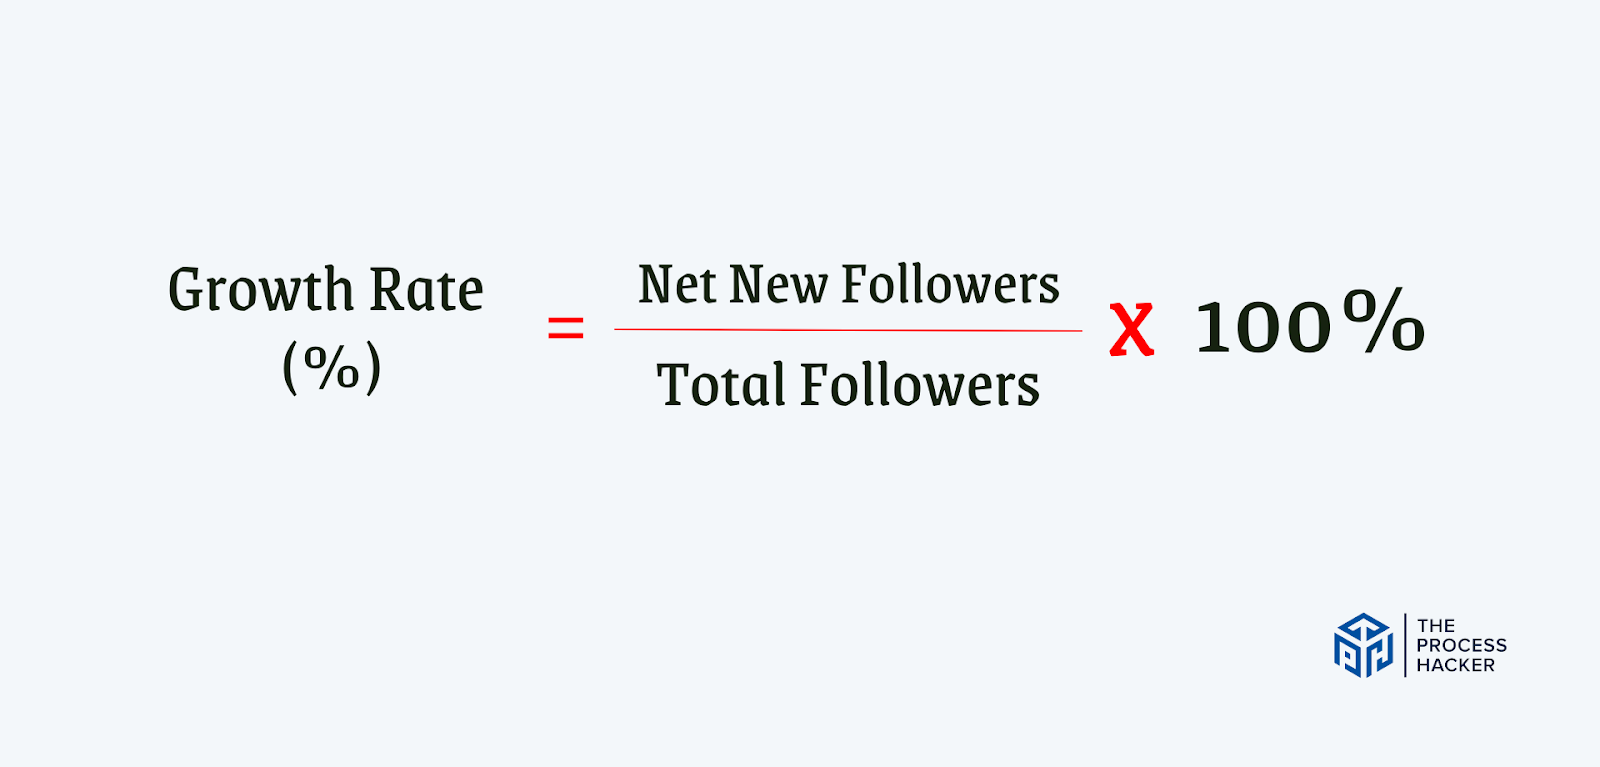
Audience Growth Rate (AGR) measures the speed at which your follower count is increasing on your social media platforms. To calculate AGR, take the number of net new followers (total new followers minus any lost followers), divide by the total followers, and multiply the result by 100.
This gives you a percentage representing your growth over a specific period. A high AGR indicates that you're attracting new followers faster than losing them, which shows how effective your content and engagement strategies are.
But here's the catch - growth is only sometimes beneficial for the sake of growth, so it's critical to attract followers who engage with your content and are interested in buying your offers. So, use this metric with engagement rate and follower demographics to ensure that you're growing and attracting a relevant and engaged audience.
Website Performance Metrics
Understanding your visitors is crucial when it comes to your website. Search engine optimization (SEO)
Website Visitors or Sessions
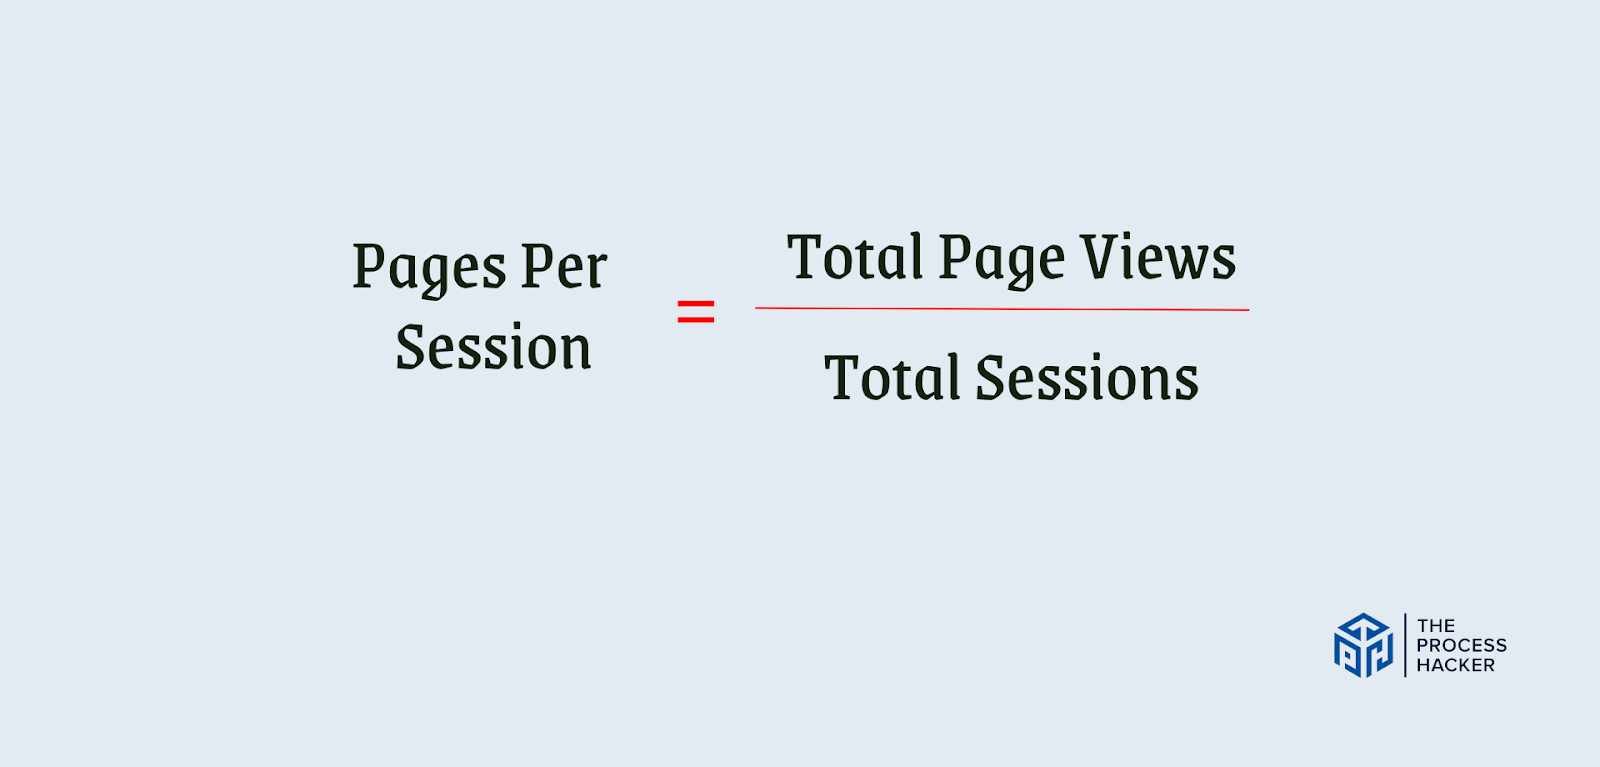
Website Visits or Sessions are the number of individual visits to your website over a certain period. The Pages Per Session metric is calculated by dividing the total pageviews by the total sessions.
Think of it as a window into your visitors' browsing habits. This metric gives you an idea of how many pages visitors view on average during a single session. A higher Pages Per Session value means that users find your content engaging and dive deeper into your website.
Conversely, a low Pages Per Session shows that your site's content isn't capturing visitors' interest, leading them to exit faster. By monitoring this metric, you can understand user behavior, evaluate your content, and ultimately improve engagement and retention on your website.
Page Views
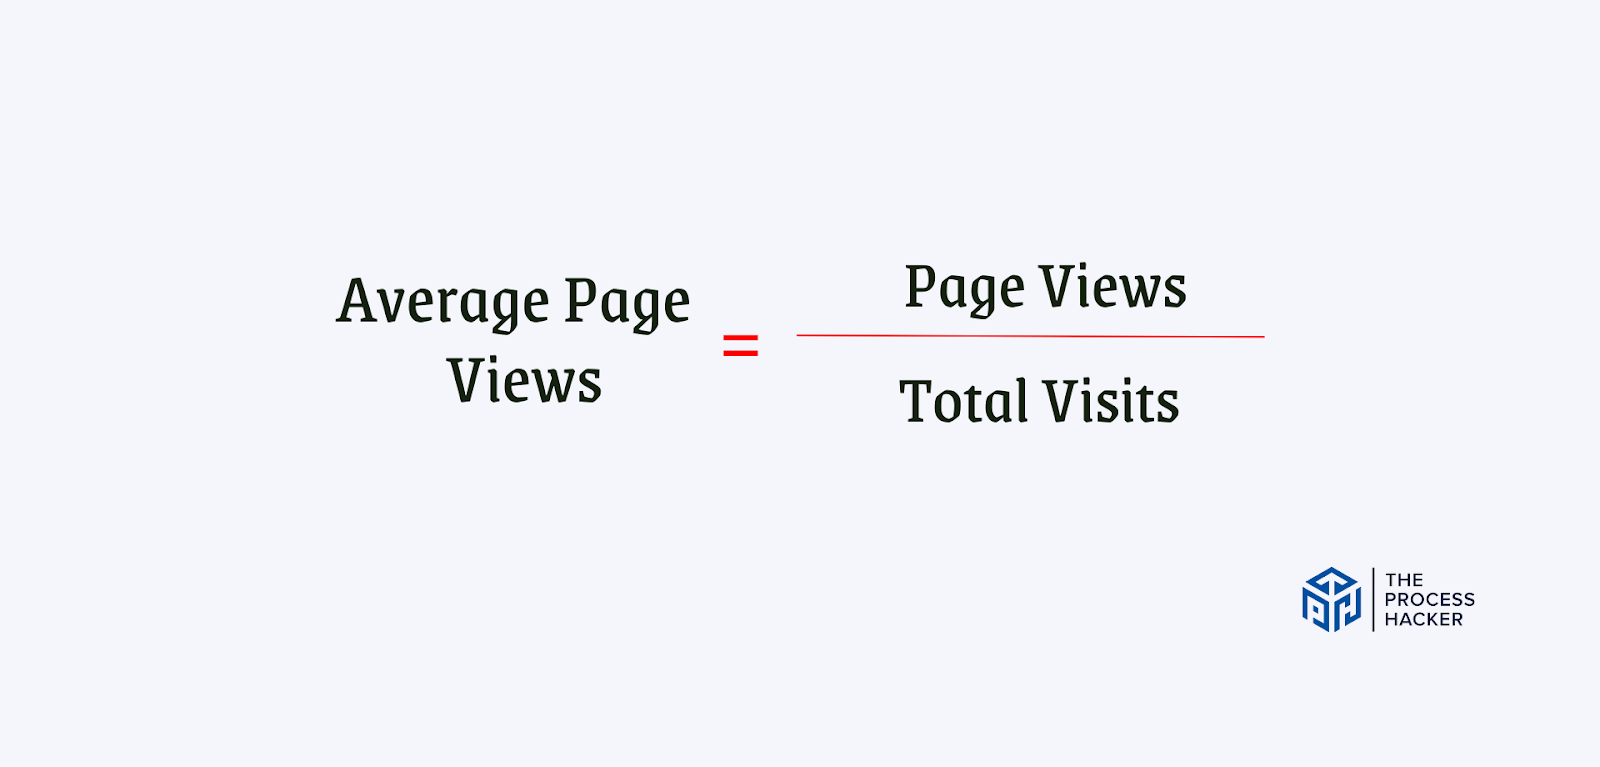
Page Views are the total number of times a specific page on your website has been viewed or refreshed in a browser. The average Page Views metric is calculated by dividing the total number of page views by the total number of visits to your site.
This metric shows you how often your content is being consumed. A higher average suggests that visitors engage more with your content, indicating its relevance and quality.
Note that a low average may suggest that your audience is dissatisfied with your content and leaves your website without further exploration. This metric lets you evaluate and enhance your content to increase user engagement and retention.
Bounce Rate
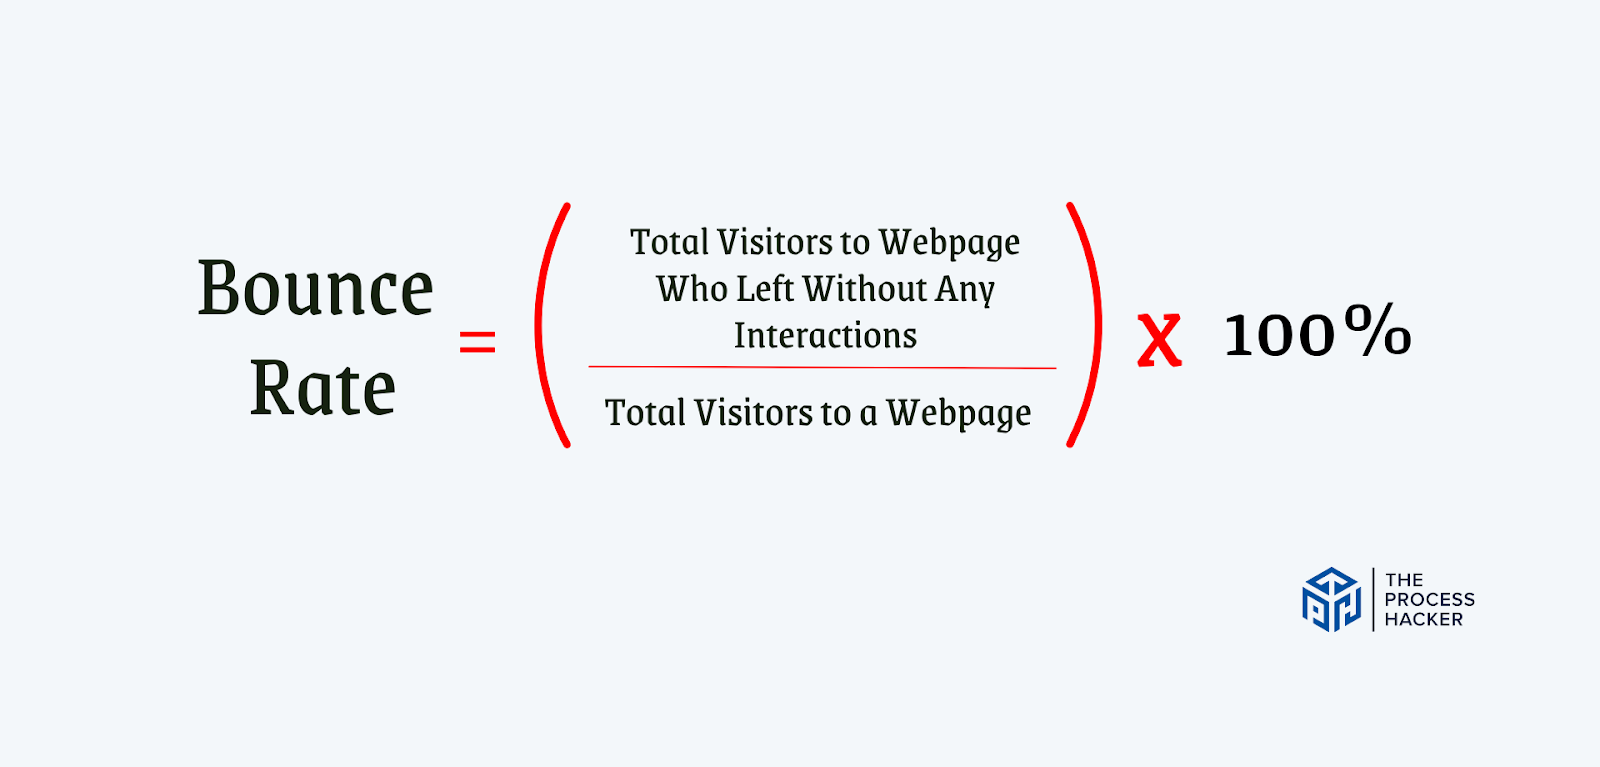
The Bounce Rate measures the percentage of visitors who land on your webpage and leave immediately without further interaction, such as scrolling, clicking on a link, filling out a form, or purchasing. It's calculated by dividing the total number of visitors who left without any interactions by the total visitors to a webpage, all multiplied by 100.
A high bounce rate could indicate that your site's navigation is confusing, your page load speed is too slow, or your content isn't meeting the user’s search intent. On the other hand, a low bounce rate suggests visitors find your content valuable and relevant, leading them to explore more of your website.
Monitoring and understanding your bounce rate allows you to identify potential issues with your site and make necessary improvements to enhance user engagement and retention.
Domain Rating (DR)
Domain Rating (DR) measures the strength and popularity of your website's backlink profile on a scale from 0 to 100. It indicates how authoritative search engines perceive your website based on the number and quality of other websites that link to you.
A high DR suggests that your website has a strong standing in your industry and is likely to rank higher in search engine results. Conversely, a low DR could indicate that your site lacks high-quality backlinks, negatively impacting your SEO performance.
By monitoring your DR, you can evaluate the effectiveness of your content quality, website traffic, and link-building efforts to strategize how to improve them. Remember, it's not just about quantity; the quality of your content and backlinks also matters.
Backlinks or Referring Domains
Backlinks are the links from other websites that point to your site. By monitoring your backlinks, you learn about your website's reputation and influence within your industry.
The quantity and quality of backlinks significantly impact how visible your website is and where it ranks on search engine results pages. The more high-quality backlinks you have, the better your chances of ranking higher in search results.
But wait. It's not just about the number of backlinks; the quality matters, too. Links from reputable and relevant sites are much more helpful than those from low-quality or irrelevant sites.
Lastly, backlinks also help you spot opportunities to build more links, boosting your SEO and increasing your site's visibility.
Webinar Engagement Metrics
Webinar Engagement Metrics are crucial for understanding how well your webinars resonate with your audience. They help you understand attendee behavior, content effectiveness, and overall webinar success, which can help you improve future webinars.
Webinar Registrants
Webinar Registrants are individuals who have expressed interest in your webinar by signing up or registering for it. This metric is crucial as it gives you an initial count of how many people your webinar content attracts.
Many registrants indicate that your webinar topic, promotional efforts, or both are effective and appealing to your target audience. Conversely, fewer registrants may suggest your topic isn't resonating, or your promotional efforts must be ramped up or optimized.
These metrics also help you plan for future webinars by showing you what topics or types of promotion work best for your audience.
Webinar Attendees
Webinar Attendees are the individuals who registered for your webinar and actually attended it. This metric shows the true reach of your webinar and the level of interest or commitment from your audience.
The number of attendees compared to the number of registrants shows the effectiveness of your reminders and the convenience of your webinar timing. A high attendee rate suggests that you're doing well in these areas, while a low rate may indicate a need for improvement.
Knowing the number of your webinar attendees helps you better plan your resources, improve your webinar delivery, and ultimately, drive more sales from your webinars.
Cost Per Webinar Attendee
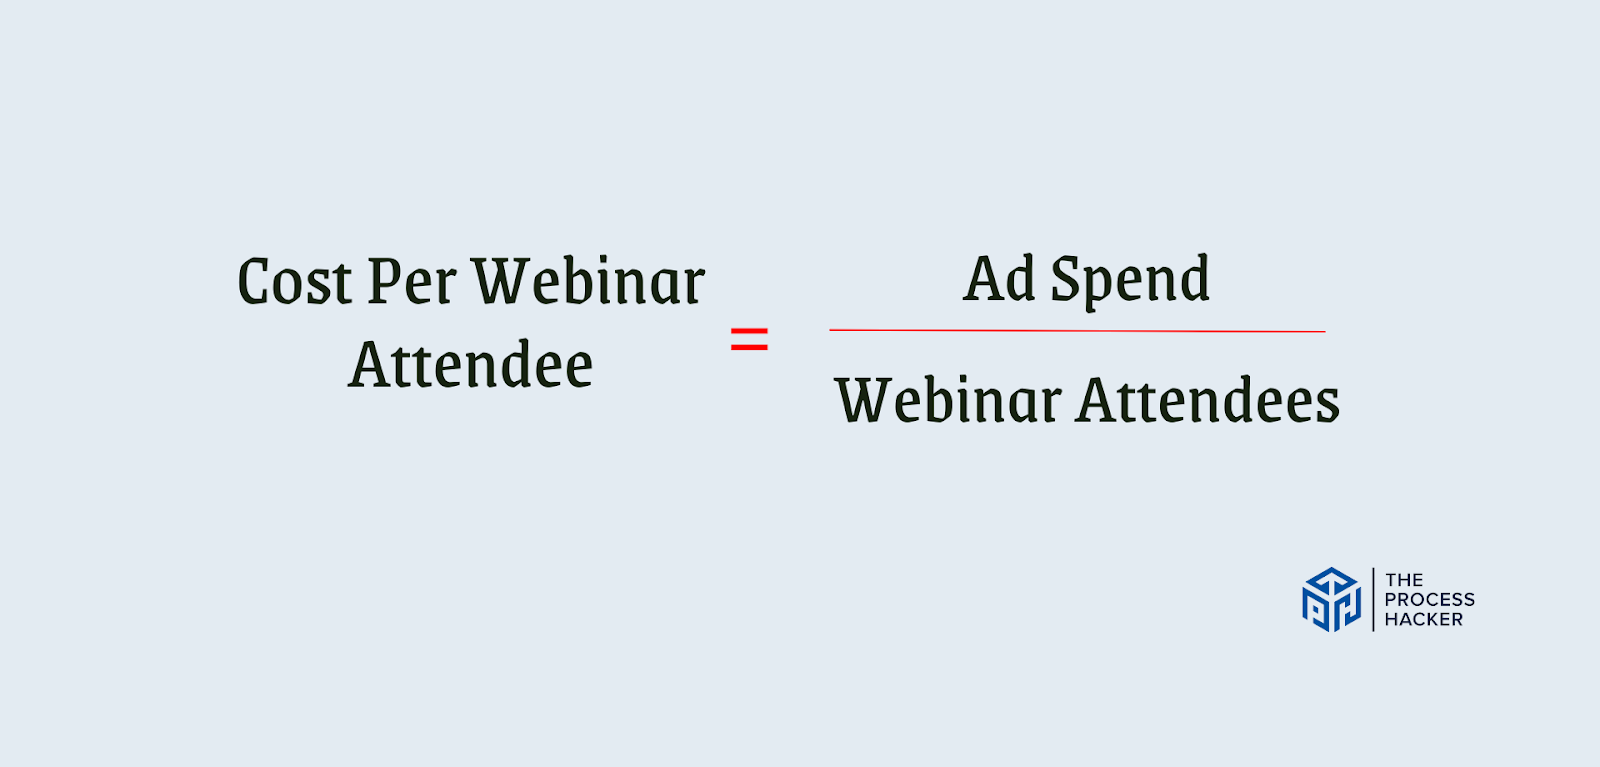
Cost Per Webinar Attendee shows you the financial efficiency of your webinar marketing efforts. Basically, you calculate it by dividing the total amount you've spent on ads by the number of attendees at your webinar.
It gives you a clear picture of how much you invest for each person attending your webinar. If the cost is high, it could signal that your advertising strategy needs tweaking or that your webinar content may not be as appealing as it should be. Conversely, a low cost suggests that your advertising is hitting the mark and that you're getting a great return on your investment.
By monitoring your Cost Per Webinar Attendee, you can make solid decisions about where to invest your marketing budget and how to maximize the impact of your webinars.
Webinar Conversion Rate
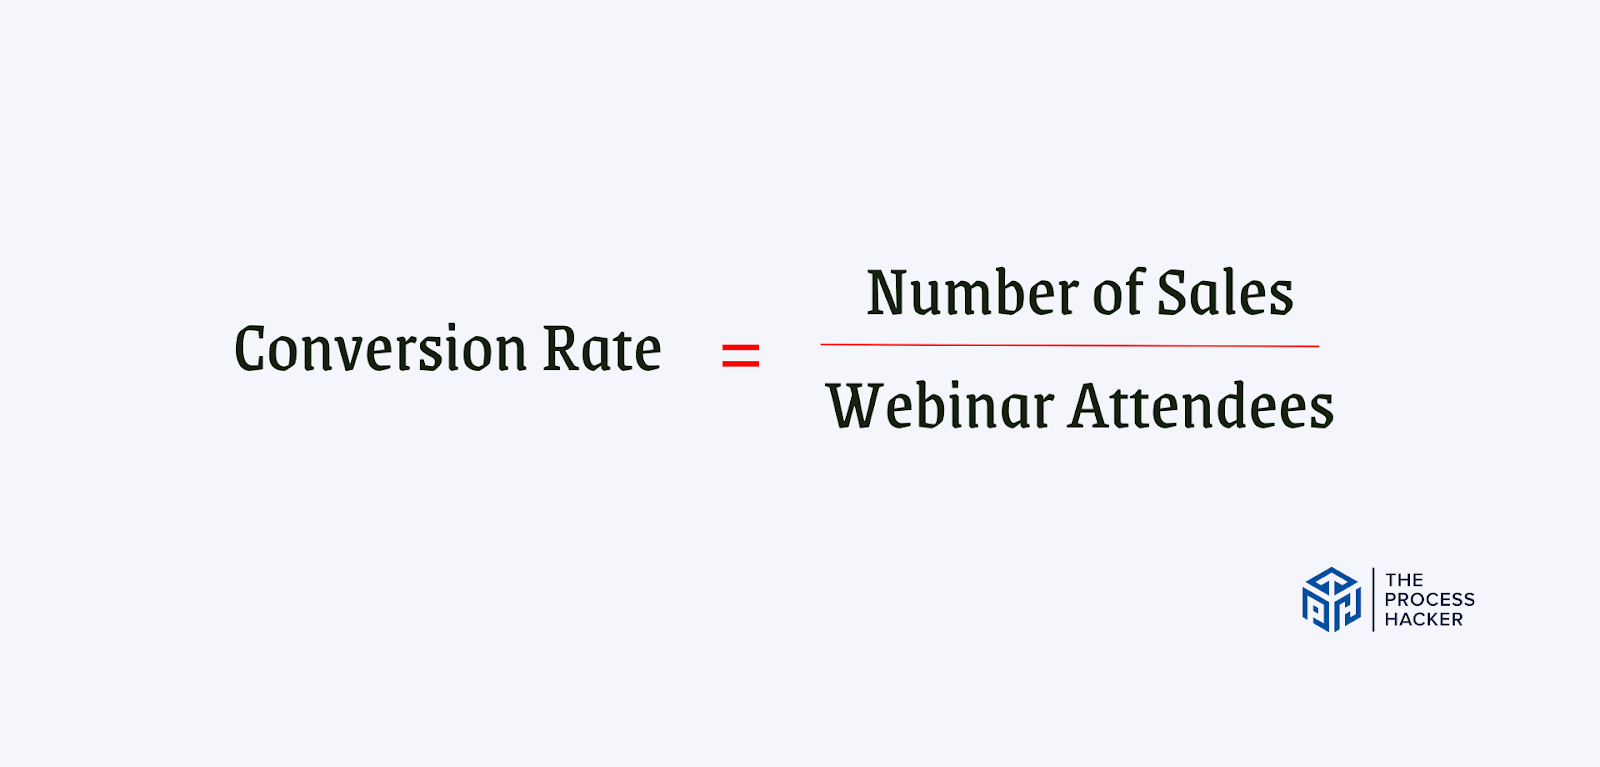
Webinar Conversion Rate measures the effectiveness of your webinars to convert attendees into paying customers. This rate is determined by dividing the total number of sales by the number of webinar attendees.
If the conversion rate is high, it shows that your webinars effectively convince attendees to purchase your product or service. However, if the rate is low, it might indicate issues with your webinar content, offer, or presentation style.
Tracking your webinar conversion rate lets you spot areas for development and make improvements to boost its efficacy. This could include improving your content, distribution, product, or service to meet audience needs.
Email Marketing Metrics

Email marketing metrics can help you gauge the effectiveness of your emails. To improve these metrics, personalize your emails, segment your audience based on their interests, and provide valuable content that resonates with your audience.
Email Subscribers
Email subscribers are individuals who have opted in to receive emails from your website or business. They are vital as they represent an interested and engaged audience you own and control.
Building an engaged email list lets you deliver targeted and personalized messaging straight to subscriber inboxes, increasing the likelihood of lead nurturing and sales conversion. Moreover, the more subscribers you have, the more opportunities you have to promote your products, services, or content.
With a loyal and active subscriber base, you can enhance your brand awareness, drive website traffic, and ultimately increase revenue.
Subscriber or Audience Growth Rate (AGR)
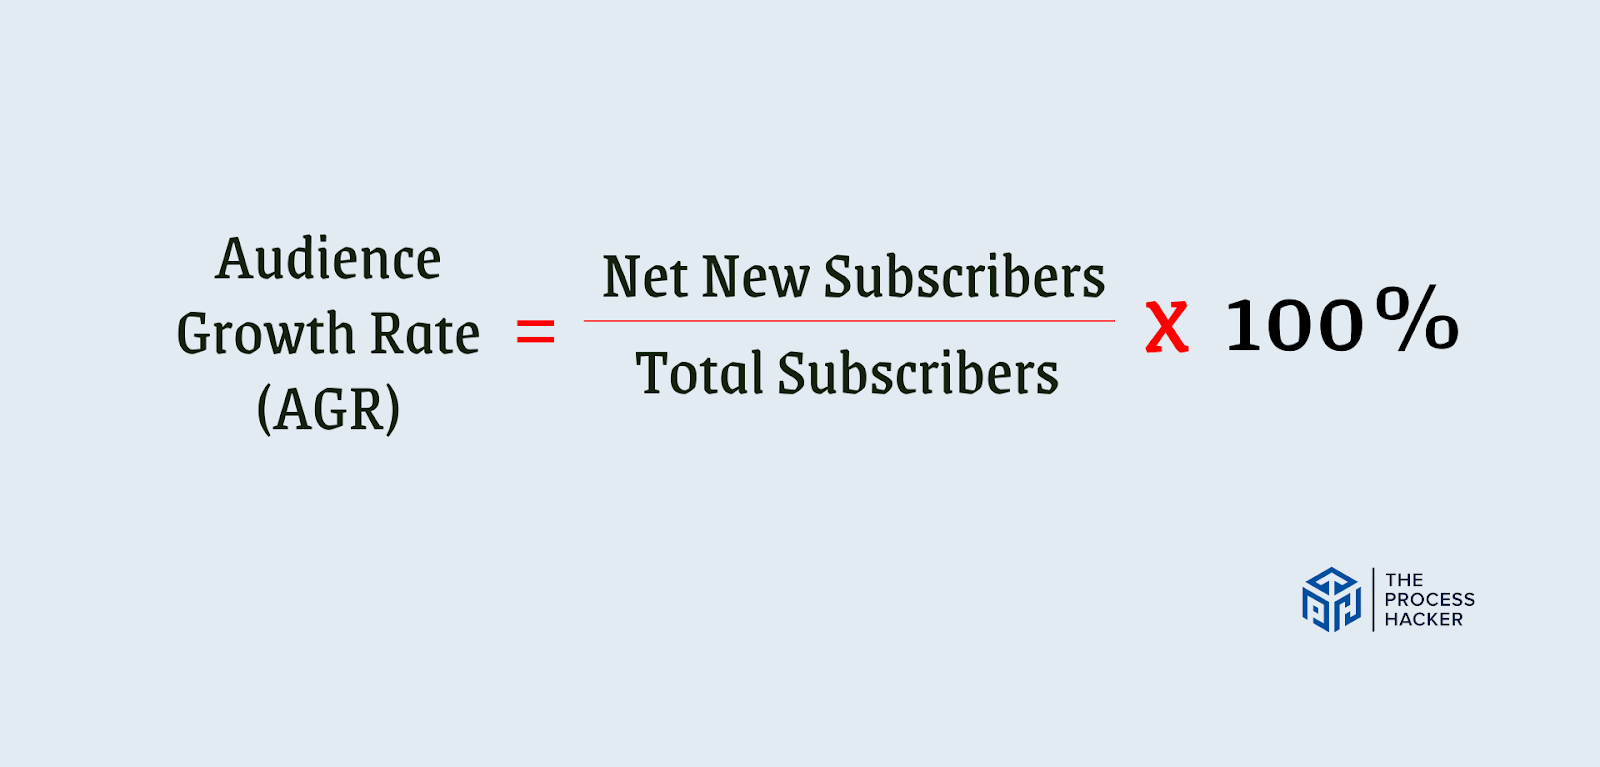
Subscriber or Audience Growth Rate (AGR) tells you how fast your email subscriber list is growing. You can calculate it by taking the net new subscribers (total new subscribers minus unsubscribes and email or spam complaints), dividing that by the total number of subscribers, and then multiplying by 100.
A high AGR shows that you're doing a great job engaging and attracting new subscribers, which means your content is hitting the mark. Conversely, a low or negative AGR means there might be some issues with attracting new subscribers or keeping the ones you've got.
Monitor your AGR regularly to spot trends, address problems, and adjust your email strategy as needed. Tweak and adapt your content, opt-in procedures, or promotions to keep those subscribers rolling in!
Email Open Rate
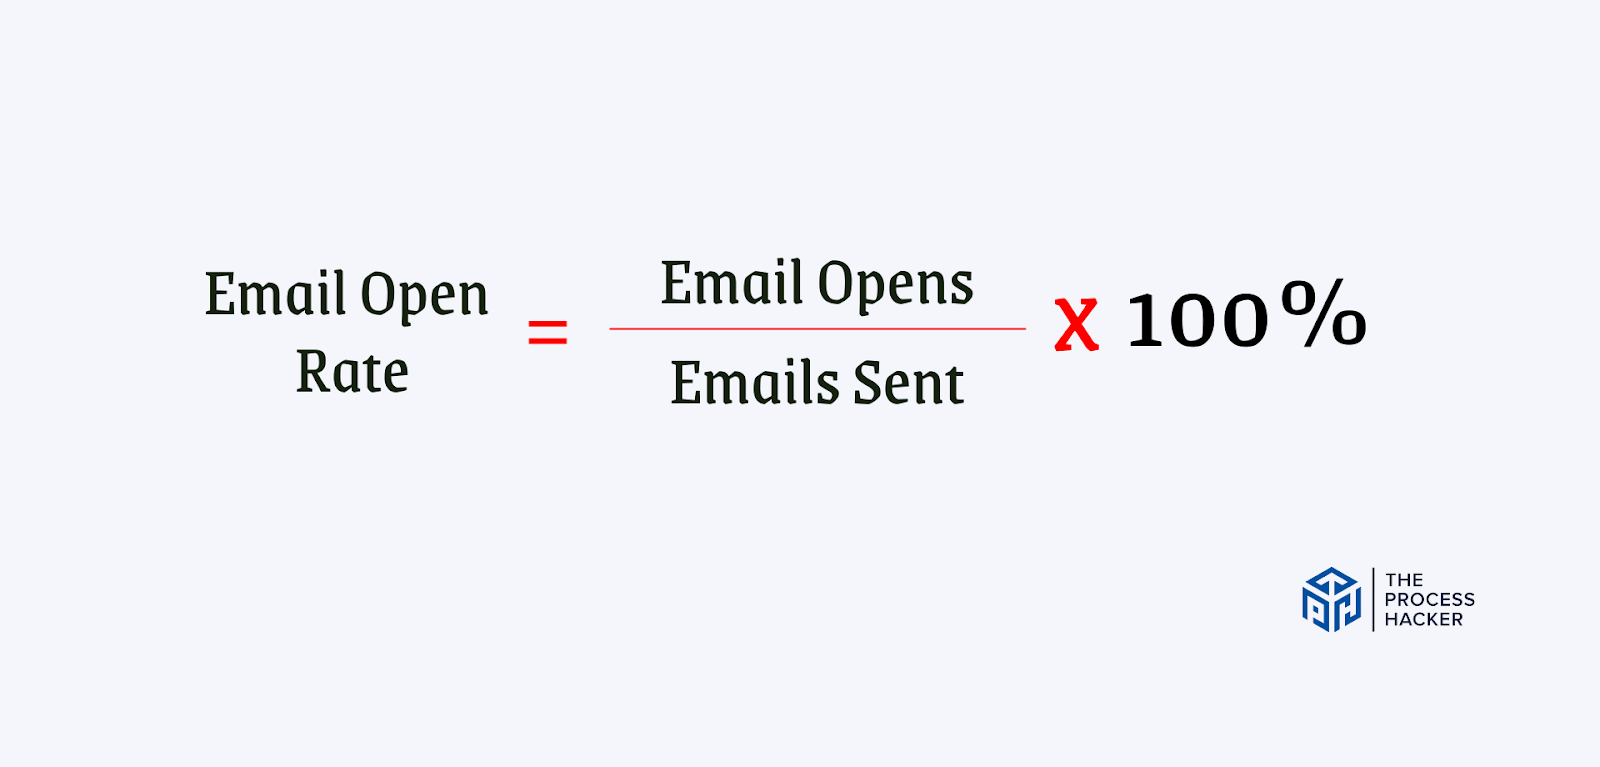
The Email Open Rate tells you the percentage of people who are opening your emails. To calculate the Open Rate, divide the total number of emails opened by the total number of emails sent and then multiply that by 100.
Tacking the Email Open Rate is a great way to immediately see how well your email campaigns are doing. If you have a high open rate, your subject lines are grabbing people's attention and hitting the mark. Conversely, a low open rate could mean your emails get lost in the shuffle or marked as spam.
By monitoring your Email Open Rate, you can work on improving your subject lines, sender name, and send times, which help your emails stand out and get opened. Remember, getting people to open your emails is the first step in getting them engaged with your email marketing.
Click Through Rate (CTR)
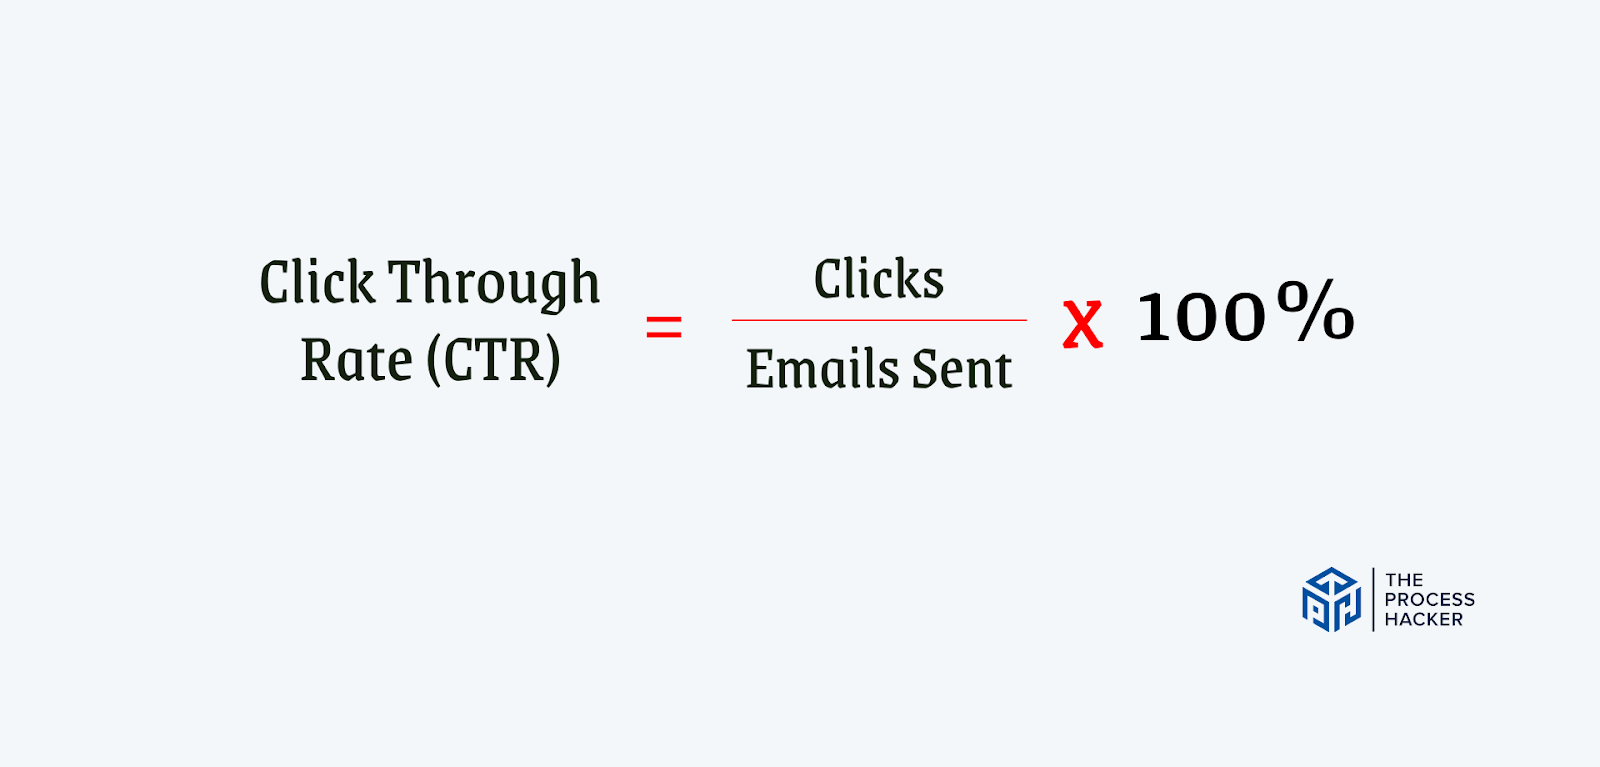
The Click-through Rate (CTR) measures the percentage of email recipients who click on a link in your email. You can calculate it by dividing the number of clicks by the number of emails sent and then multiplying the result by 100.
CTR shows you how captivating your email content is to your audience. A high CTR means your message hits home with your subscribers, prompting them to take action. Conversely, a low CTR suggests that your content needs to be improved or your call-to-action needs a boost.
You can improve CTR by polishing your email content and making your calls-to-action more irresistible. Experiment with different content styles, link placements, and CTA designs to see what resonates best with your audience.
Ultimately, your goal is to get your emails opened, inspire action, and drive your subscribers toward conversion, making your email marketing campaigns more impactful than ever.
Paid Marketing Campaigns
Paid Marketing Campaigns are strategic, targeted efforts where you spend money to promote your brand, products, or services. As a marketer, understanding and tracking the performance of these campaigns is crucial for your business growth and return on investment.
Ad Spend or Marketing Spend
Advertising or marketing spending is the total amount spent on paid campaigns. This includes costs related to pay-per-click advertising, social media ads, influencer partnerships, sponsored content, and more.
Understanding your ad spending is vital because it directly affects your marketing budget and the profitability of your campaigns. Tracking this metric ensures that your efforts are cost-effective and yield a positive return on investment (ROI). It's essential to optimize your ad spending to reach the most relevant audience without exceeding your budget.
To use this metric effectively, compare your ad spend with other vital metrics such as sales revenue, lead generation, or website traffic to understand if your investment drives the desired outcomes. If your ad spend is high but these metrics aren't improving, you may need to reassess your paid marketing strategies.
Click Through Rate (CTR)
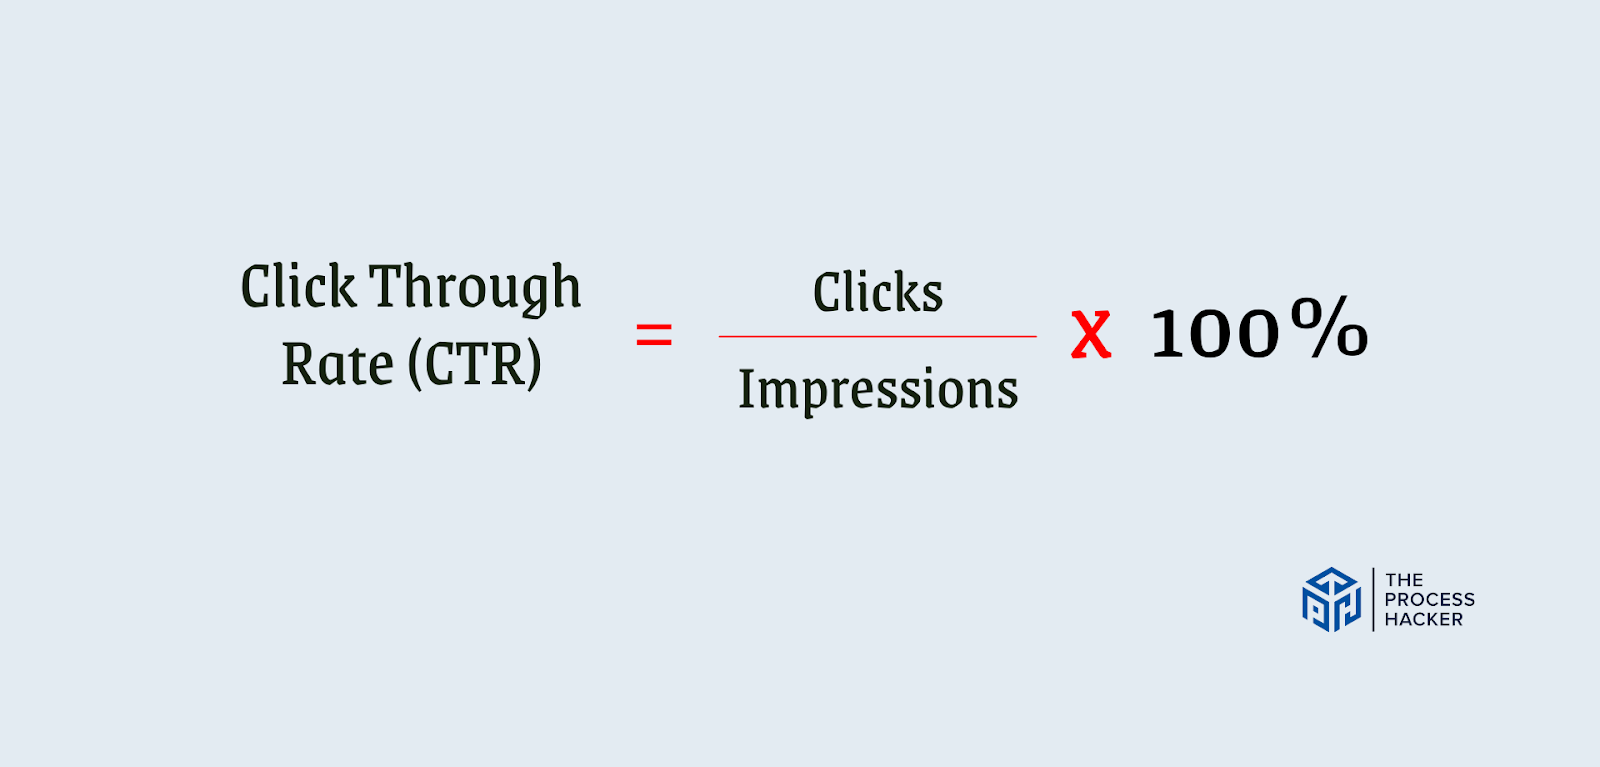
Click-through Rate (CTR) shows the percentage of people who actually click on your ad after seeing it. It's calculated by dividing the total number of clicks your ad gets by the total number of times it's shown (impressions) and then multiplying that result by 100.
This metric clearly shows how captivating and relevant your ad is to your target audience. A high CTR tells us that your ad hits the mark and grabs people's attention, making them want to know more. Conversely, a low CTR means your ad might not be hitting home with your audience, and it's time to rethink your ad content or targeting strategy.
To really maximize CTR, you need to consider it alongside other important metrics like conversion rate and ad spend. This will help you see not just how many people are clicking your ad but also how many of those clicks are turning into actual conversions and at what cost.
If you’ve got a high CTR but a low conversion rate, you can tweak your landing page or offer to better meet the expectations for your ad. It's all about ensuring your ad doesn't just stop at getting a click but leads to meaningful action.
Cost Per Click (CPC)
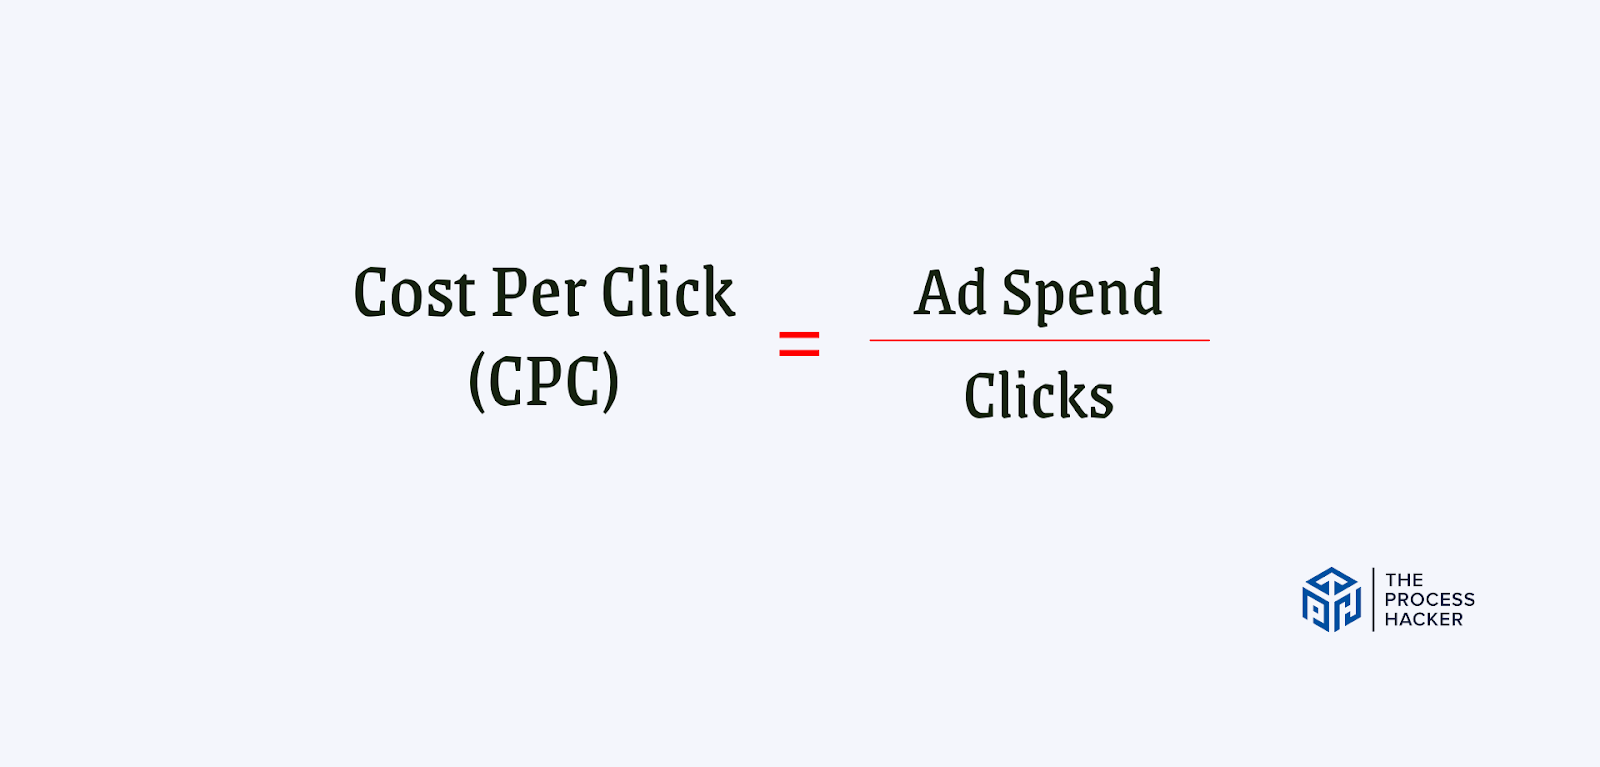
Cost Per Click (CPC) tells you how much you're paying for each click on your ad. You calculate it by dividing your ad spend by the number of clicks you get. CPC matters because it directly impacts your marketing budget and your return on investment.
If your CPC is low, you're paying less for each visitor to your site, potentially leading to a better return on your investment if those clicks turn into actual sales. Conversely, a high CPC means you are paying too much for each click, which could affect your profits, especially if those clicks aren't leading to sales.
You can improve CPC by comparing it to other key metrics, like your conversion rate and sales revenue. This can help you determine how much you're paying for each click and how many clicks are turning into profitable actions. If your CPC is high but your conversion rate is low, it might be time to rethink your ad content, targeting strategy, or bidding approach.
Cost per Lead (CPL)
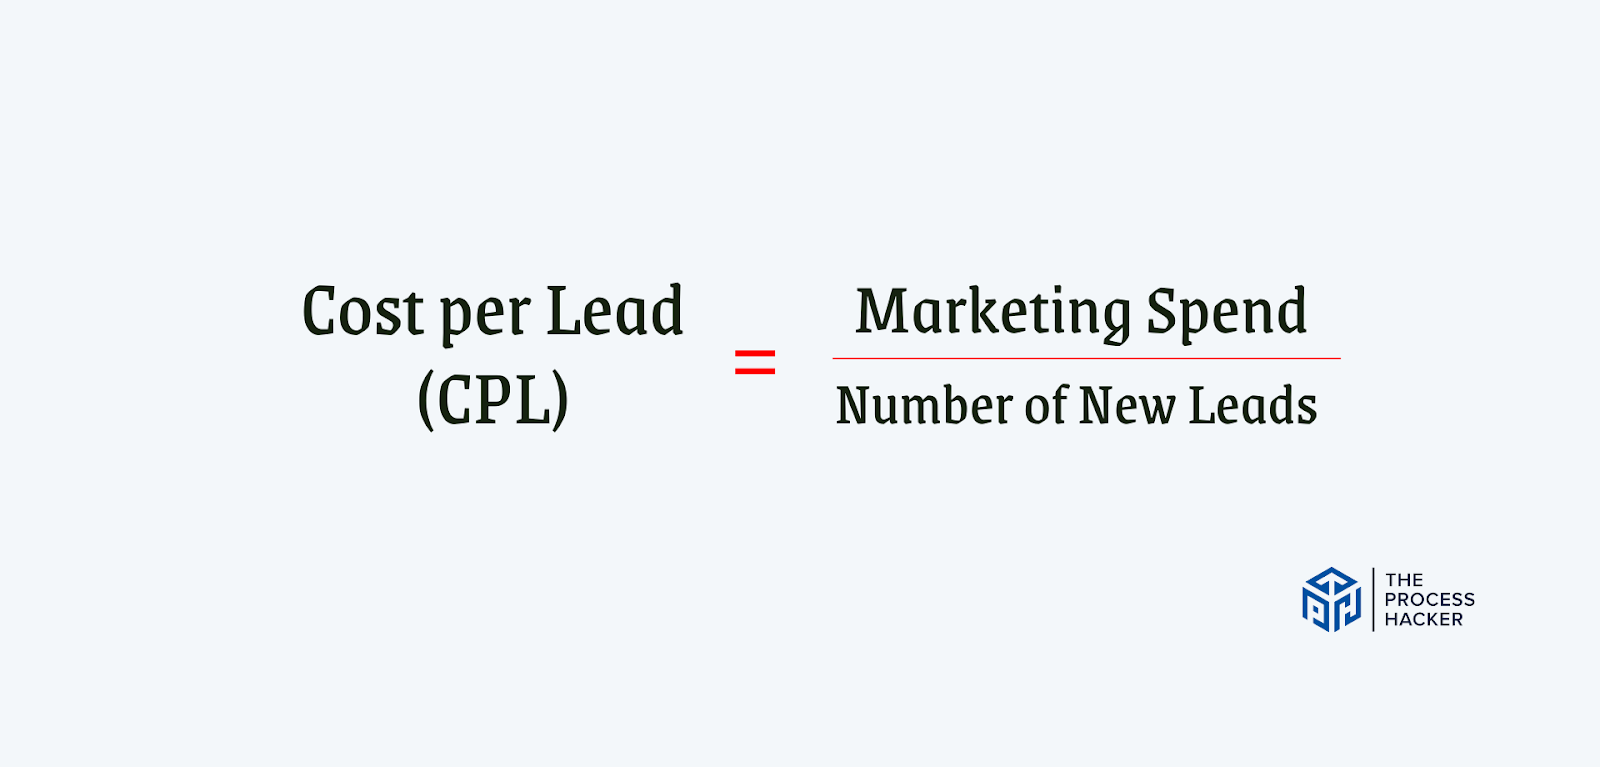
Cost per Lead (CPL) measures the average cost of acquiring a new lead through your efforts. It's calculated by dividing your total ad spend by the number of new leads generated.
Understanding your CPL is crucial for you because it helps determine the profitability of your campaigns. A lower CPL means you're spending less to acquire each new lead, potentially increasing your return on investment. However, a high CPL could indicate that you're paying more than necessary for each lead, which might reduce your overall profits.
This measure should be linked to lead quality and conversion rates to be most effective. If your leads have a low CPL yet aren't converting or making big purchases, you may need to change your targeting approach or lead qualifying. A higher CPL may be acceptable if high-quality leads are likely to convert into high-value consumers.
Cost Per Sales Opportunity (CPSO)
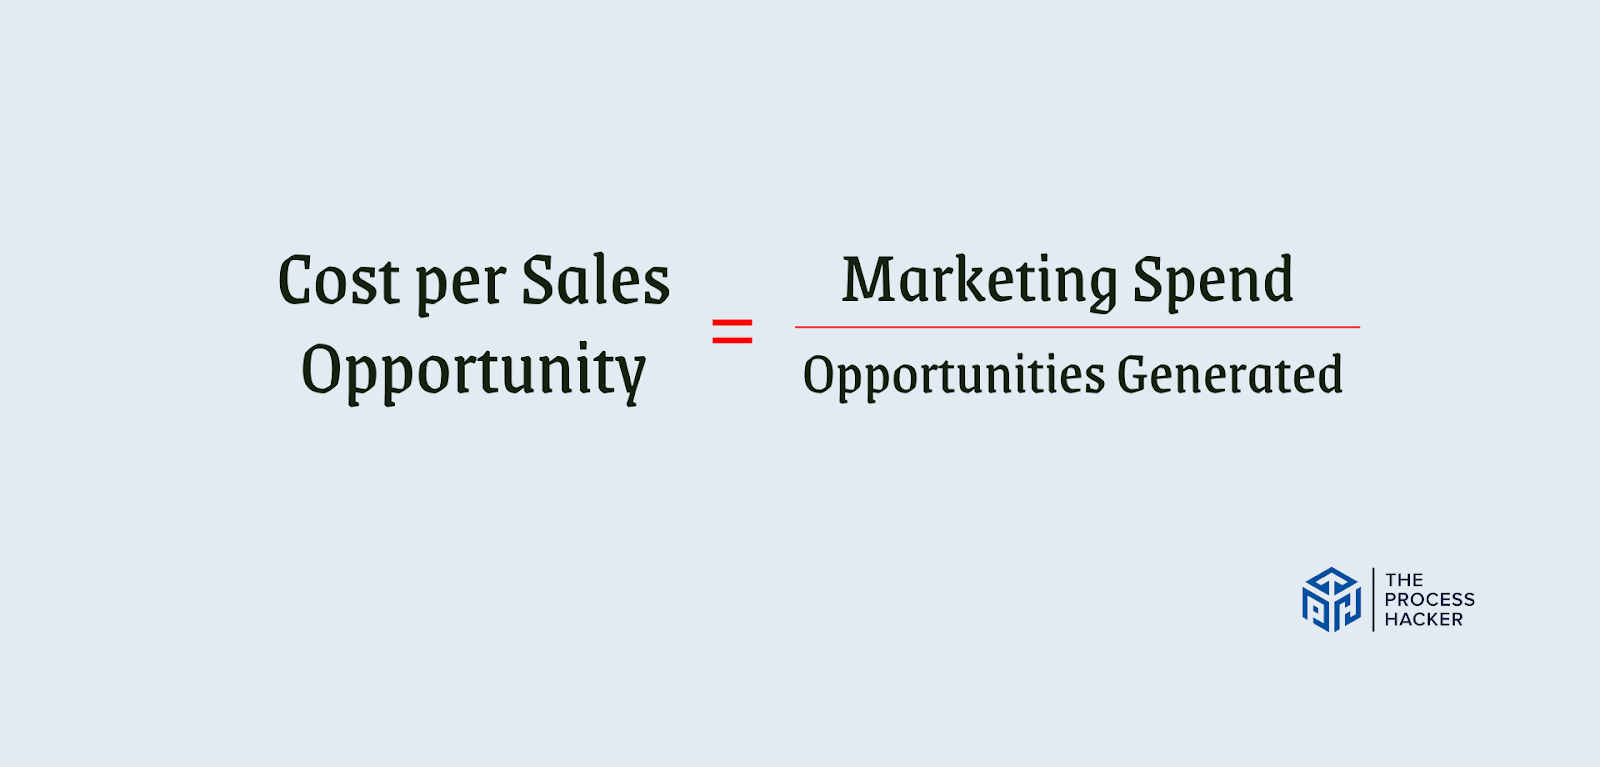
The Cost Per Sales Opportunity (CPSO) is crucial for understanding the efficiency of your investment in generating potential sales leads. This metric is calculated by dividing the total cost of your marketing campaign by the number of sales opportunities it created.
Utilizing this metric effectively allows you to assess the return on investment (ROI) of your efforts and helps in budget allocation. If CPSO is high, you should reevaluate your campaign strategy or audience targeting to ensure you're reaching the most relevant prospects. If it’s low, then your campaign is efficiently driving potential sales, which allows you to replicate successful strategies in future campaigns.
Customer Acquisition Cost (CAC)
Your Customer Acquisition Cost (CAC) represents the total cost of acquiring a new customer. It is calculated by dividing the total costs of your acquisition efforts by the number of customers acquired over the same period.
Understanding your CAC is essential for evaluating the effectiveness and sustainability of your marketing strategies. It helps determine how much you spend to gain a new customer, guiding your budgeting decisions. An optimal CAC should be balanced against a customer's lifetime value to ensure profitability.
Regularly assessing this metric allows you to identify areas for cost optimization and refine your marketing strategies for better ROI. Remember that a lower CAC indicates a more efficient campaign, while a higher CAC might suggest a need for strategy refinement or cost reduction efforts.
Return on Ad Spend (ROAS)
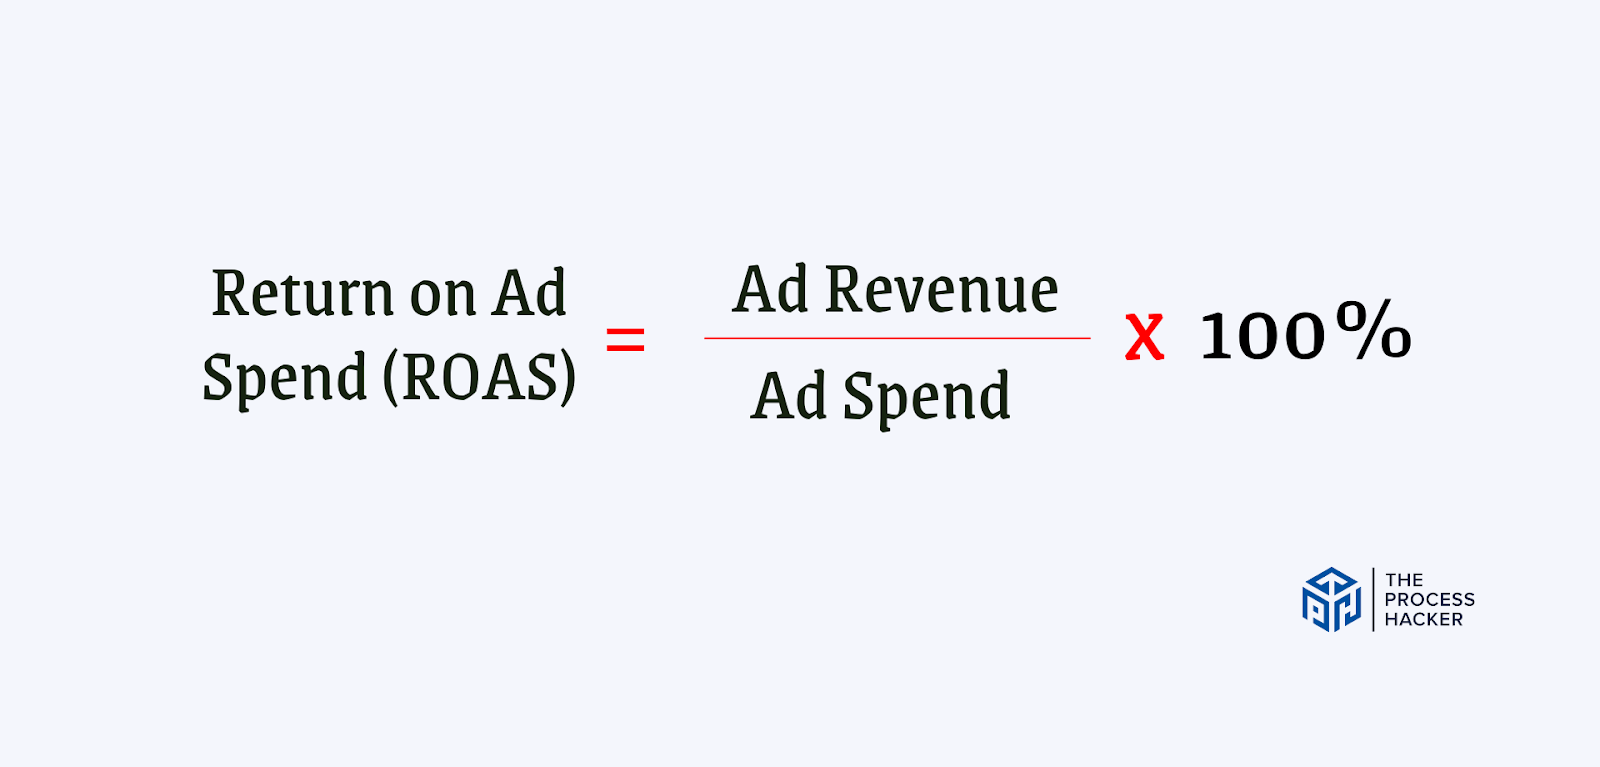
Your Return on Ad Spend (ROAS) tells you how much revenue you generate for every dollar spent on advertising. It's calculated by dividing your ad revenue by your ad spend and multiplying it by 100.
ROAS indicates the efficiency of your advertising efforts. A higher ROAS means your ads effectively drive sales, while a lower ROAS might signal the need for a strategy adjustment.
To maximize this metric, compare your ROAS against industry benchmarks and your own historical performance to gauge the success of your campaigns. You should also use ROAS to allocate your budget, focusing on high-performing channels and campaigns.
For example, optimizing your ads for better targeting and messaging can significantly improve your ROAS, leading to more efficient and profitable advertising.
Potential Customers
Identifying and understanding potential customers is fundamental in your efforts to market your business. This section will delve into key metrics that help you gauge the effectiveness of your strategies in reaching and engaging potential customers.
Leads Generated
Leads Generated shows the number of potential customers interested in your product or service. It reflects the effectiveness of your marketing campaigns in attracting prospects and initiating the first step of their journey toward becoming customers.
Thus, you should track the number of leads generated over specific periods and compare these figures against your marketing activities. This helps you identify which strategies are most successful in attracting potential customers.
Additionally, analyzing the quality of these leads, such as their likelihood to convert into customers, is vital for refining your marketing tactics and focusing efforts on the most promising prospects.
Discovery Calls Booked
Discovery Calls Booked helps you understand how effectively you're engaging potential customers. This metric counts the scheduled calls between your sales and marketing teams and potential clients, often following initial contact or interest in your service or product.
These calls are critical for your sales process, providing an opportunity for personalized engagement and lead generation. To use this metric effectively, track the number of discovery calls over time and correlate them with your efforts. This helps you identify which strategies are most successful in progressing, leading to a more engaged, conversational stage.
Additionally, analyzing the outcomes of these calls shows the quality of your leads generated and informs improvements in your marketing and sales approaches. Regularly review your booked calls so you can fine-tune your initial customer engagement and lead nurturing strategies.
Marketing Qualified Leads (MQL)
A Marketing Qualified Lead (MQL) is a lead who has shown interest in your marketing. Typically, they are qualified based on specific criteria and behaviors, such as downloading a whitepaper, signing up for a webinar, or repeatedly visiting your website.
This metric helps you understand which aspects of your marketing attract leads and engage them effectively enough to move them further down the sales funnel. You should regularly review the criteria that define an MQL, ensuring they align with your evolving marketing strategies and sales goals.
By analyzing the conversion rate of MQLs to actual sales, you learn how qualified your leads are and how effective your lead nurturing processes are. This lets you optimize your marketing tactics to generate higher-quality leads and improve overall sales efficiency.
Sales Qualified Leads (SQL)
A Sales Qualified Lead (SQL) is a potential customer who has been evaluated and deemed ready for the direct sales approach. Unlike MQLs, SQLs are prospects that your sales and marketing teams consider prepared for a more in-depth engagement, typically after undergoing initial qualification by your marketing team.
This metric helps you differentiate between general interest and genuine sales potential, allowing for more focused and effective sales efforts. Thus, you should work closely with your sales team to establish clear criteria for an SQL. This might include actions like a lead requesting a demo, filling out a contact form, or explicitly showing interest in buying.
Regularly analyzing the conversion rate of SQLs into actual customers shows you how effective your sales and marketing are, helps fine-tune your lead nurturing strategies, and improves the quality of leads passed onto sales.
Sales Conversion Rate
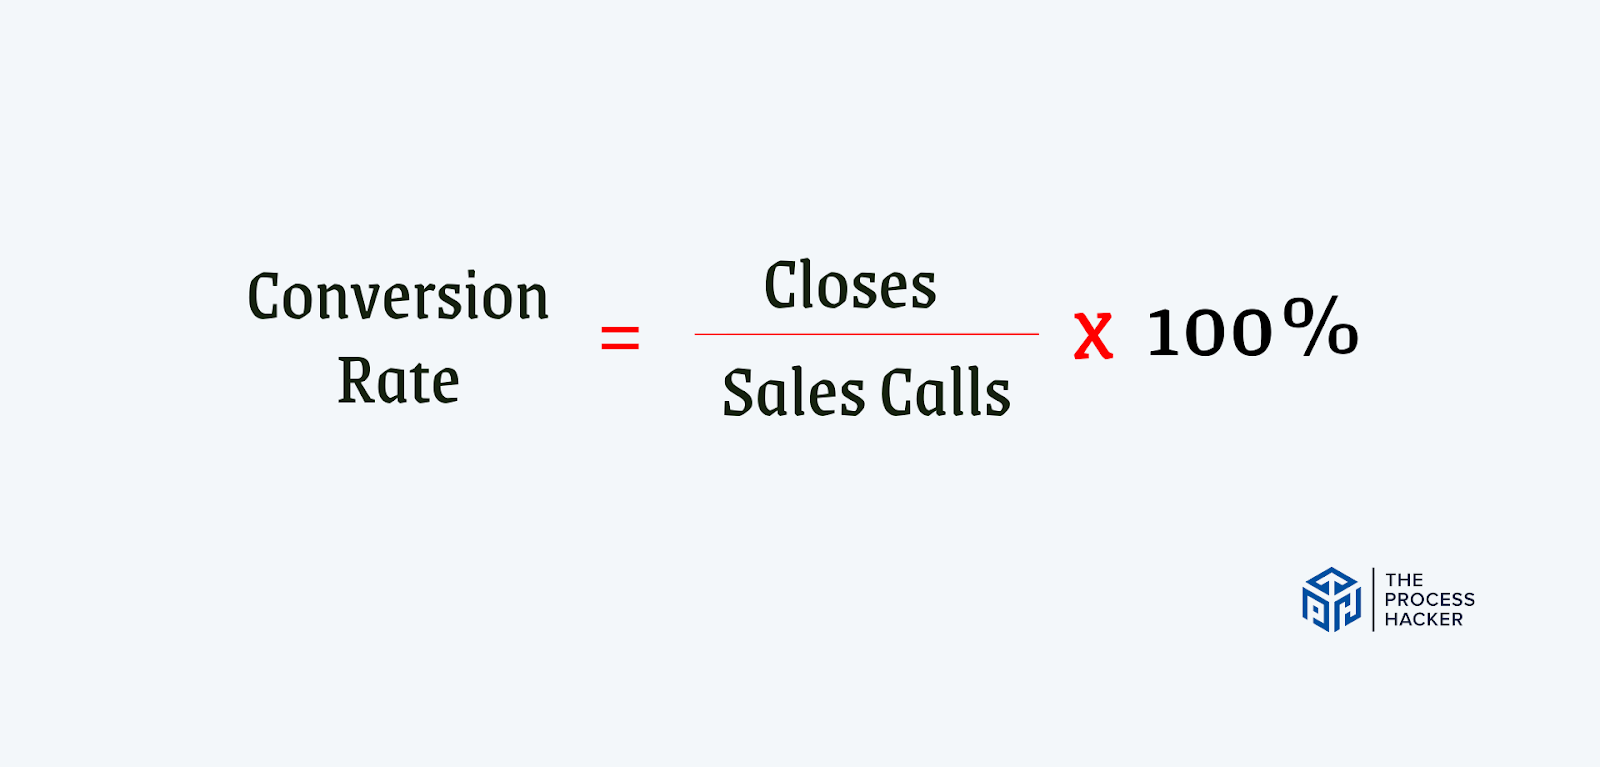
The Sales Conversion Rate shows you how effectively your interactions with potential customers turn into actual sales. It is calculated as the percentage of paying customers out of the number of sales calls held.
A high Sales Conversion Rate indicates a robust sales process and effective communication with leads. Conversely, a low conversion rate could indicate issues in your sales approach or lead quality.
To improve your Sales Conversion Rate, it's essential to regularly review your sales process and identify any potential bottlenecks or areas for improvement. This could include streamlining communication with leads, providing more targeted and personalized information during the sales process, or reevaluating your lead scoring system.
Existing Customers
Focusing on existing customers is just as crucial as acquiring new ones. This section explores key metrics that help you understand and enhance the relationship with your current customer base.
Net Promoter Score (NPS)
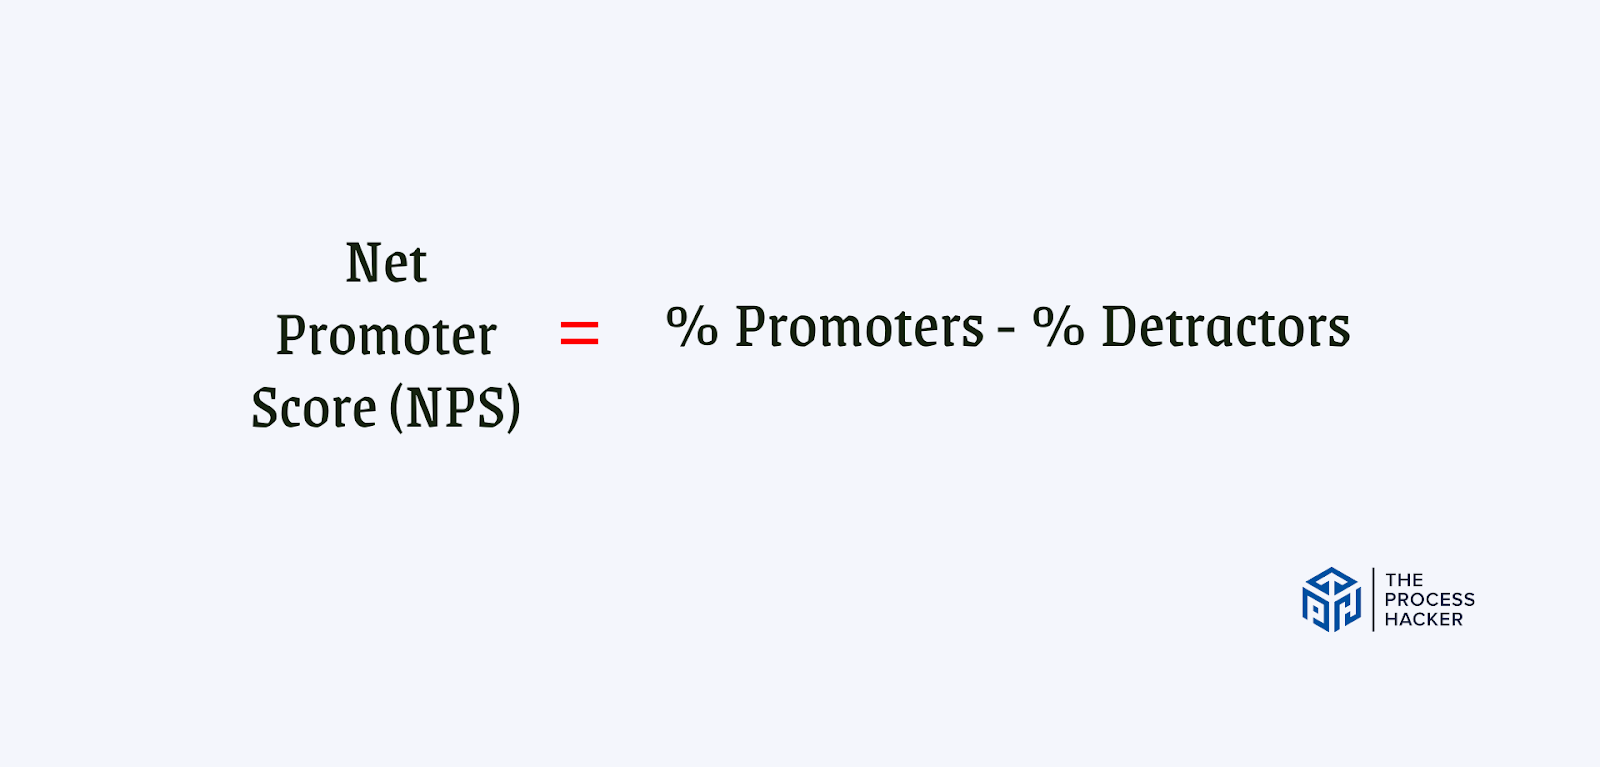
The Net Promoter Score (NPS) helps you gauge customer satisfaction and loyalty. It's calculated by subtracting the percentage of detractors (customers who wouldn't recommend your product/service) from the rate of promoters (customers who are likely to recommend your product/service).
A higher NPS indicates a healthier customer relationship, suggesting that your customers are satisfied and willing to advocate for your brand. You should regularly survey your customers to see how likely they are to recommend your brand to others. Analyzing your NPS over time helps you understand customer satisfaction and loyalty trends.
Actively responding to positive and negative feedback shows your commitment to customer satisfaction and can lead to improvements in your product or service. This ongoing process helps you build a loyal customer base and significantly influences your brand's growth and reputation.
Average Customer Lifespan
Average Customer Lifespan measures the average duration a customer continues to buy products and services from your business. It indicates your customer loyalty and the long-term value of customer relationships.
This metric helps you gauge the effectiveness of your customer retention strategies. A longer lifespan signifies strong customer relationships and satisfaction, indicating that your products or services continually meet or exceed customer expectations. Conversely, a shorter lifespan demonstrates that your business needs to improve its customer experience or address any recurring issues.
By analyzing lifespan, you can identify factors contributing to customer retention or attrition. This helps you refine your digital marketing and service strategies to enhance customer satisfaction and loyalty, ultimately increasing your customer base's lifetime value.
Customer Lifetime Value (CLV)
The Customer Lifetime Value (CLV) is the total revenue you can expect from a single customer throughout their relationship with your business. To calculate CLV, you combine the average purchase value, the average number of purchases, and the average customer lifespan. It helps you understand the long-term value of your customer base and informs you how much you should invest in maintaining and acquiring customers.
Understanding your CLV enables you to make informed decisions about your digital marketing spend, customer service, and product development. It guides you in identifying the most profitable customer segments and allocating resources accordingly.
A high CLV suggests strong customer loyalty and effective cross-selling or upselling strategies, while a low CLV might indicate the need for improved customer engagement or retention strategies. Regularly analyzing and working to enhance your CLV can lead to increased profitability and sustainable business growth.
Key Considerations For Successfully Using the Right Marketing Metrics
Remember that these digital marketing indicators are only valuable when correctly interpreted and applied—not just the numbers but also how they reflect your marketing and customer behavior.
Here are the critical considerations for successfully using the right marketing metrics:
- Proper Interpretation and Application: Ensure these digital marketing metrics are correctly interpreted and applied, focusing on how they reflect your efforts and customer behavior.
- Align Metrics with Business Goals: Choose the right marketing metrics that align with your business objectives, like prioritizing conversion rates or customer acquisition costs for performance marketing and social media engagement for brand-focused campaigns.
- Importance of Data Context: Understand the context behind your metrics. Deep analytics are necessary to uncover underlying trends and patterns.
- Analyzing Sudden Changes: When noticing a sudden increase in website traffic or other metrics, assess whether it's due to a successful campaign, a seasonal trend, or an outlier.
- Actionable Insights from Data: Convert your metric data into actionable insights to effectively steer your marketing decisions and strategies.
- Adapting Strategies Based on Data: Based on insights gathered from your data analysis, be ready to modify your marketing approach, budget, or target audience.
- Regular Review and Analysis: Continuously analyze marketing analytics to ensure they inform every aspect of your marketing plan.
How To Use Marketing Metrics For Your Marketing Strategy
Digital marketing analytics must be integrated into every level of planning and execution to improve strategy. Here’s how to use the marketing metric for your plan:
- Integrate Analytics at All Levels: To enhance your strategy, incorporate digital marketing analytics into every aspect of your planning and execution.
- Set Quantifiable Targets: Establish measurable targets that align with your business goals, setting realistic yet challenging objectives.
- Focus on Key Metrics for Goals: For goals like brand awareness, concentrate on metrics such as reach and impressions and adjust strategies to improve these numbers.
- Adaptability Based on Data: Be flexible and allow data to guide your marketing strategy, making adjustments based on metric outcomes.
- Resource Reallocation for Efficiency: Shift resources away from underperforming channels or campaigns to more effective ones.
- Utilize A/B Testing and Monitoring: Regularly employ A/B testing and monitoring for a data-driven approach to strategy optimization.
- Promote Data Literacy Among Team: Educate your sales team on the importance and interpretation of marketing metrics.
- Regular Data Analysis and Sharing: Encourage your marketing staff to routinely analyze and discuss data to foster brainstorming for improvements and innovations.
- Unified Strategy for Business Goals: Collaboratively focus on metrics to develop a more cohesive and successful strategy that aligns with business objectives.
Get The Right Marketing Tools
You need the correct marketing tools to boost your marketing. These tools simplify data collection and processing and reveal insights that are hard to get manually. Find tools for social media analytics, email marketing performance, customer relationship management, or site traffic analysis.
Look for automations that let these technologies work together effortlessly to get a fuller picture of your marketing performance. Integrating your CRM system with your email marketing tool can reveal how email campaigns affect customer behavior and sales.
These tools capture data and make it understandable and actionable. Use tools with simple interfaces and customizable dashboards to access key KPIs easily. These solutions let you focus less on data collection and more on strategic analysis and decision-making, improving marketing results.
Alternative KPIs: Important Metrics In Other Business Areas
While focusing on marketing metrics, you should also be aware of other key performance indicators in your firm that can affect marketing success. Customer service indicators like average response time and resolution rate can reveal customer happiness and loyalty, affecting brand reputation and marketing efficacy.
Marketing metrics like average transaction size, sales cycle length, and pipeline velocity can inform your tactics. Understanding these data helps you match your efforts to your sales team's needs, generating leads that convert and build your organization.
Operational indicators like labor productivity and costs indirectly affect marketing results. Operating efficiently frees up resources for marketing, while strong productivity speeds up marketing endeavors. Monitoring these alternative KPIs ensures a more holistic approach to corporate performance through data-driven decisions.
Final Thoughts on Marketing Metrics
Marketing metrics may seem overwhelming and daunting at first, but with the right strategy and tools, they can prove to be your greatest ally in maximizing your marketing efforts.
So go ahead and crunch those numbers, track those clicks, and analyze those conversion rates! With each metric you measure, you are one step closer to understanding the impact of your marketing campaigns and making data-driven decisions that will ultimately drive growth for your business.
Remember, not all metrics are created equal – focus on the ones that align with your goals and objectives. And don't forget to take a step back from time to time to evaluate the bigger picture – after all, behind every number is a real person being influenced by your brand.
By finding the right balance between data and creativity, you can create genuinely impactful and successful marketing strategies. So go forth and measure your marketing efforts!